

Public Sector Finances: December 2018
4th February 2019
Office For Budget Responsibility Report.
Deficit continues to fall significantly in 2018-19.
Higher spending pushed borrowing up slightly in December, relative to the same month last year. But over the first nine months of 2018-19, borrowing is still down by more than a quarter relative to the same period in 2017-18.
• Public sector net borrowing (PSNB) in December 2018 is provisionally estimated at £3.0 billion,
£0.3 billion up on the same month last year and £0.7 billion above market expectations.
• Last month's estimate of PSNB over the first eight months of 2018-19 was revised up £0.2
billion to £33.0 billion.
• Year-to-date PSNB stands at £35.9 billion, down £13.1 billion (26.7 per cent) on the same
period in 2017-18. Our October EFO forecast of £25.5 billion for 2018-19 as a whole
implies a £16.4 billion fall (39.2 per cent) over the full financial year.
• Year-to-date central government receipts (excluding PSNB-neutral transfers related to
‘quantitative easing') are 4.7 per cent up on the same period in 2017-18 - in line with our
full-year forecast of a 4.7 per cent rise (on a like-for-like basis).
• Year-to-date central government spending (excluding PSNB-neutral grants to local
authorities) is up 2.9 per cent on last year - slightly less than our full-year forecast of a 3.1
per cent rise (on a like-for-like basis).
• Net debt was 0.5 per cent of GDP lower in December 2018 than a year earlier. This
comparison is still being affected by the addition to debt from monetary policy measures.
1. The Office for National Statistics and HM Treasury published their Statistical Bulletin on
the December 2018 Public Sector Finances this morning, covering the first nine months
of the 2018-19 fiscal year.
2. Public sector net borrowing (PSNB) is provisionally estimated at £3.0 billion in
December, £0.3 billion up on the same month a year earlier and £0.7 billion above
market expectations of £2.3 billion. The £3.1 billion rise in central government (CG)
spending (excluding PSNB-neutral grants to local authorities) more than offset the £2.5
billion rise in CG receipts (excluding APF transfers) relative to last December. Borrowing
by local authorities was £0.4 billion lower on a year earlier, while borrowing by public
corporations was £0.1 billion higher.
3. The year-on-year rise in borrowing in December leaves year-to-date borrowing down
slightly less than was reported in last month's data release. Year-to-date borrowing is
£13.1 billion (26.7 per cent) lower than in the same period in 2017-18. Meeting our
latest EFO forecast for PSNB in 2018-19 as a whole would require a fall of £16.4 billion
(39.2 per cent) from the latest estimate of 2017-18 outturn. Chart 1.1 shows outturn
PSNB on a 12-month rolling basis, relative to our latest full-year forecast for 2018-19.
Central government receipts
4. Relative to the same period last year, CG receipts (excluding APF transfers) were up 4.3
per cent in December and 4.7 per cent for the year-to-date. The latter is in line with our
full-year forecast on a like-for-like basis. Strength in receipts so far in 2018-19 has
been particularly evident in PAYE income tax - up 5.5 per cent year-to-date compared
with a full-year forecast of 4.4 per cent. This reflects unexpectedly strong earnings
growth in recent months. Growth in VAT receipts is now marginally below our full-year
forecast, at 5.1 versus 5.2 per cent.
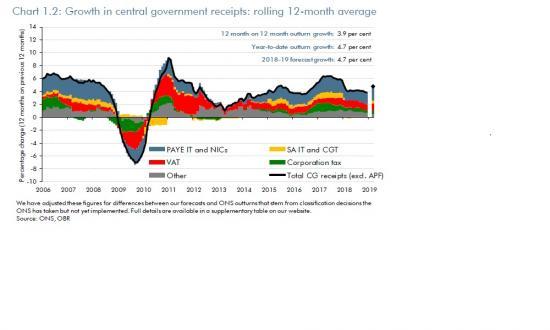
5. Chart 1.2 shows that year-to-date growth in CG receipts is broadly in line with our EFO
forecast. On a rolling 12-month basis, outturn receipts growth is marginally below our
full-year forecast. That largely reflects the fall in self-assessment income tax and capital
gains tax receipts at the end of 2017-18, which will drop out of the year-on-year
comparison by the end of 2018-19.
Central government spending
6. Relative to last year, total CG spending (excluding grants to local authorities) was up 6.2
per cent in December and 2.9 per cent for the year-to-date, with the latter slightly below
our October forecast of a 3.1 per cent rise over the full year (on a like-for-like basis).
The rise in CG spending in December was driven by an increase in ‘other' CG current
and capital spending (reflecting higher departmental spending) and higher transfers to
EU institutions (up £1.5 billion on last December).2 On the latter, the UK received a
large credit (£1.2 billion) in December 2017. This reflected amendments to the EU's
budget that were, in turn, largely due to lower-than-budgeted EU spending on structural and investment funds, but also reflected standard updates to its estimates of Member
State contributions. The net effect of the same factors led to a £0.3 billion payment
being made in December 2018. Net social benefits expenditure was also up (by £0.5
billion, reflecting higher spending across several benefits), but this was offset by debt
interest payments being £0.5 billion lower (reflecting the monthly path of RPI inflation,
which affects accrued interest paid on index-linked gilts).
7. The main driver of weaker spending growth over the first nine months of 2018-19 has
been debt interest, which is 8.2 per cent lower than in the same period last year - a
somewhat sharper decline than our full-year forecast of a 6.3 per cent fall. Growth in
departmental current spending for the year-to-date has been weaker than we forecast
for the full year, but these data remain provisional and subject to future revision.
8. Chart 1.3 shows that outturn CG spending growth is below our full-year forecast on a
year-to-date basis, but in line with our full-year forecast on a rolling 12-month basis.
That largely reflects departmental spending, as set out above.
Debt
9. Public sector net debt (PSND) in December 2018 was down 0.5 per cent of GDP from a
year earlier, less than the 1.3 per cent of GDP fall we forecast in the EFO for the year to
the end of 2018-19. The comparison continues to be distorted by the Bank of England's
August 2016 monetary policy measures (which raised PSND by £18.2 billion or 0.9 per
cent of GDP in the year to December 2018). This effect will diminish over the rest of
2018-19. Lower borrowing and higher nominal GDP provide the main downward
contributions to the fall in the debt-to-GDP ratio. Chart 1.4 shows the outturn debt-toGDP ratio, relative to our latest forecast for end of 2018-19.
The full report is longer and contains more graphs and charts. See it at - https://obr.uk/docs/dlm_uploads/December-2018-Commentary-on-the-Public-Finances-1.pdf