Household total wealth in Great Britain: April 2018 to March 2020
9th January 2022
Report from the Office for National Statistics - 7 January 2022.
Main points
In April 2018 to March 2020:
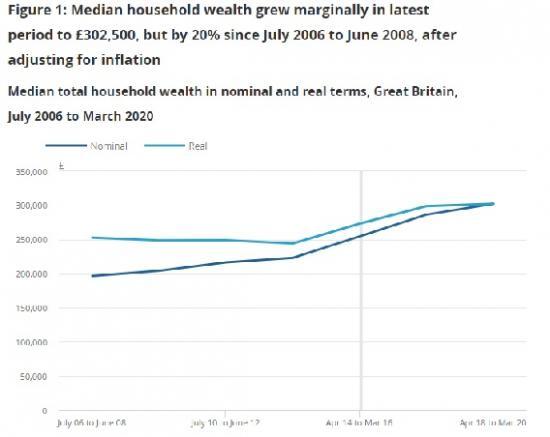
Median household net wealth in Great Britain was £302,500, a marginal increase on the previous period but a 20% increase compared with July 2006 to June 2008, after adjusting for inflation.
The wealth of the richest 1% of households was more than £3.6 million, compared with £15,400 or less for the least wealthy 10%; wealth inequality as measured by the Gini coefficient has remained stable over the last 14 years.
Median wealth was highest for households whose head was aged 55 years to under State Pension age (£553,400); the wealth of this group was 25 times higher than those aged 16 to 24 years.
Household median wealth was highest in the South East at £503,400, having risen 43% since 2006 (after adjusting for inflation); wealth was lowest in the North East at £168,500.
Regions with the lowest median household wealth (North East and Scotland) saw a decrease in wealth compared with the previous period, of 7% and 12% respectively after adjusting for inflation; London also experienced a large decrease of 8% while the East and West Midlands saw the largest growth, at 14% and 13% respectively.
Looking at economic status, households where the head was retired were the wealthiest group (£489,300); they also had lower expenditure and more stable primary income source, as such were more likely to withstand impacts to household finances resulting from the coronavirus (COVID-19) pandemic.
Total net wealth
Household wealth indicates availability of resources and can help assess financial resilience including the ability to use assets to withstand income loss (such as through the effects of the coronavirus (COVID-19) pandemic).
For the latest period, (April 2018 to March 2020), median household net wealth was just over £300,000. Although a marginal increase on the previous period this is a 20% increase since July 2006 to June 2008, after adjusting for inflation. Average wealth as measured by the median remained generally stable since 2006, except for the period between 2014 and 2018 which saw reasonable growth across all components of wealth.
Total net wealth includes four main components:
net property (value of residences minus mortgage debt)
physical (household contents, vehicles)
private pension
net financial (savings or investments minus financial liabilities)
The share of wealth accounted for by each of the four components has remained stable in the latest period, with net property and private pension wealth the biggest components, together accounting for more than three-quarters of total wealth.
Over the last 14 years the proportion of wealth held in private pensions has increased slightly. This category is now the largest component of total wealth at 42%. Over the same period the proportion of wealth held in property fell slightly and was 36% in the latest period. Reasons for this change could include:
lower levels of home ownership for younger people
varying pension pot valuations influenced by fluctuating annuity and discount rates
the introduction of Automatic Enrolment and the increase in the State Pension age (SPa); causing more people to contribute to their pension for longer
Financial wealth and physical wealth made up smaller proportions of total wealth at 13% and 9% respectively.
Wealth inequality
Wealth inequality is a measure of how unequally wealth is distributed across the population. The wealthiest 10% of households held 43% of all the wealth in Great Britain in the latest period; in comparison the bottom 50% held only 9%.
The richest 1% of households were those whose total wealth was more than £3.6 million (Figure 2). The least wealthy 10% of households had wealth of £15,400 or less. In this group at least half only held wealth in physical assets (with a mean value of £8,000) and almost half held more financial debt than they did financial assets.
Physical wealth was the main wealth component for the least wealthy households, (deciles 1 to 3), whereas for those households in the middle of the distribution, (deciles 4 to 7), property wealth was the largest component (Figure 3). At the top of the distribution, pension wealth was the largest component; the top 1% held average (median) household pension assets of around £2 million. In contrast, the average (median) value of pension assets for households where the head is approaching SPa, (aged 55 years to under SPa) was just over £200,000.
For most households net financial wealth was the smallest component of total wealth. However, at the top of the distribution financial wealth was far more prominent, particularly at the very top as wealth held by the richest 1% of households was greater than for the entire bottom 80% of the population.
Wealth by characteristics
Age
Wealth for households where the head was aged 55 years to under State Pension age (SPa) was 25 times higher than youngest households (aged 16 to 24 years), as measured by the median.
Typically, wealth accumulates with age. The average age of first-time buyers in England was 32 years, while participation in workplace pensions and the size of pension contributions is positively correlated with income (which also increases with age). This means wealth is likely initially to build slowly before growing at a faster rate until retirement.
After SPa household wealth declines as one of the primary assets, pension wealth is drawn upon typically in the form of lump sums and annuities.
Median wealth among households where the household reference person (HRP) is aged 25 to 34 years was almost £77,000 in April 2018 to March 2020, with most wealth held in physical assets (£30,000 on average).
For the next age group, (aged 35 to 44 years) wealth was almost three times higher (nearly £200,000) with net property the largest asset (£60,000 on average).
Economic status
When looking at economic status, the wealthiest households (measured by the median) were those where the head was retired (£489,300). Almost three-quarters of households with a retired head owned their home outright, compared with less than 30% of self-employed and less than 20% of employee-led households. With the highest levels of assets across all components of wealth, lower expenditure and a stable source of primary income, households with a retired head were more likely to better withstand impacts to household finances resulting from the coronavirus (COVID-19) pandemic.
Households where the head was self-employed were the next wealthiest group with median total wealth of £333,700, compared with wealth of £287,200 for households whose heads were employees. On average households with employee heads had higher levels of pension wealth than the self-employed, which was most likely driven by higher participation in private pensions (94% had private pension wealth compared with 79% for self-employed). This group also held larger pension pots on average, a consequence of defined benefit pensions being available to employees but not for the self-employed.
Households where the head was unemployed or inactive (but not retired) had only one-twentieth of the wealth held by those where the head was retired. Average total wealth was around £25,000 with most of these households not having property or private pensions.
Region
Comparisons of wealth and inequality by region can indicate regional differences in standards of living and employment opportunities.
The wealthiest region of Great Britain in April 2018 to March 2020 was the South East, which also saw one of the fastest increases in average (median) wealth since 2006. Median wealth in the South East was £503,400 having risen 43% since 2006 (after adjusting for inflation).
The regions with the lowest median wealth were the North East and Scotland. Average wealth in the North East (£168,500) was about one-third of the average level of wealth in the South East. The North East is one of the few regions where median wealth is lower now than in 2006 (after adjusting for inflation). Household wealth in the North East decreased the most since 2006, reducing by 17%. Both the North East and Scotland saw large decreases in median wealth compared with the previous period, of 7% and 12% respectively after adjusting for inflation, with London also experiencing a large decrease of 8%. Home ownership and pension participation rates were lower in these regions.
Although London had the lowest property ownership rate, low participation in private pensions and decreasing median wealth in the latest period, the region held 15% of all wealth in Great Britain. This is likely because of substantially higher property values in the region; median household net property wealth in the latest period for those owning property was £450,000, the highest among all regions.
Gini coefficients show that London had the most uneven distribution for total wealth and most of the different components of wealth (Figure 6). In all regions, wealth inequality was highest in net financial wealth followed by pension, net property and physical wealth. However, inequality in physical wealth was particularly high in London.
Outside London, the regions with the lowest median household wealth, (North East and Scotland) also had higher total wealth inequality. Inequality of net financial wealth was highest in the North East.
Regions with higher median wealth (the South East and East of England) had the lowest Gini coefficients for total wealth, (0.58) implying a more equal wealth distribution.
Note
The above are excerpts from the report
To read it in full with graphs and charts and links to other data go
HERE