Consumer Price Inflation, UK: January 2022 - CPI Inflation Highest Since May 1992
16th February 2022
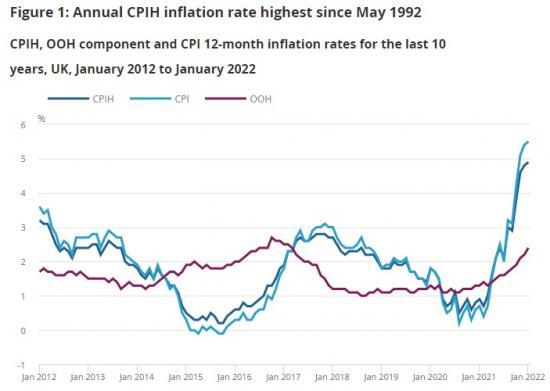
The Consumer Prices Index including owner occupiers' housing costs (CPIH) rose by 4.9% in the 12 months to January 2022, up from 4.8% in the 12 months to December 2021.
The largest upward contributions to the January 2022 CPIH 12-month inflation rate came from housing and household services (1.37 percentage points) and transport (1.24 percentage points, principally from motor fuels and second-hand cars).
On a monthly basis, CPIH was unchanged in January 2022, compared with a fall of 0.1% in January 2021.
The largest upward contributions to the change in the CPIH 12-month inflation rate between December 2021 and January 2022 came from clothing and footwear, housing and household services, and furniture and household goods.
These were partially offset by large downward contributions to change from restaurants and hotels, and transport.
The Consumer Prices Index (CPI) rose by 5.5% in the 12 months to January 2022, up from 5.4% in December 2021.
On a monthly basis, CPI fell by 0.1% in January 2022, compared with a fall of 0.2% in January 2021.
The Consumer Prices Index including owner occupiers' housing costs (CPIH) rose by 4.9% in the 12 months to January 2022, up from 4.8% to December 2021. This is the highest recorded 12-month inflation rate in the National Statistic series, which begins in January 2006, and the highest rate since CPIH stood at 5.1% in May 1992 in the historical modelled estimates. Inflation rates are currently influenced by the effects of the coronavirus (COVID-19) lockdowns in the previous year. The Office for National Statistics' (ONS') blog Beware Base Effects describes how relatively low prices for some items during those periods influence current inflation rates.
The Consumer Prices Index (CPI) rose by 5.5% in the 12 months to January 2022, up from 5.4% to December 2021. This is the highest CPI 12-month inflation rate in the National Statistic series, which began in January 1997, and it was last higher in the historical modelled series in March 1992, when it stood at 7.1%.
On a monthly basis, CPIH was unchanged in January 2022, compared with a fall of 0.1% in the same month a year earlier. Price falls in clothing and footwear, and transport led to the largest downward contributions to the monthly rate in January 2022. The main offsetting upward contributions to the monthly rate came from housing and household services, food and non-alcoholic beverages, and alcohol and tobacco. More information on contributions to change is provided in Section 4.
In January 2022 the CPI fell by 0.1% from the previous month, compared with a fall of 0.2% in the same month the previous year.
Given that the owner occupiers' housing costs (OOH) component accounts for around 17% of the CPIH, it is the main driver for differences between the CPIH and CPI inflation rates.
Housing and household services
Housing and household services contributed 1.37 percentage points to the CPIH 12-month inflation rate in January 2022, which is the largest contribution from any division this month, and is significantly above those from April to September 2021. This was a result of price rises for gas and electricity following the increase in the cap on energy prices, which changed on 1 October 2021. The Office of Gas and Electricity Markets (Ofgem) introduced energy price caps. This was to limit the price energy suppliers can charge the estimated 15 million households that either use a prepayment meter or are on the "standard variable" energy (or default) tariff. As the energy regulator, Ofgem update the energy price caps twice a year, in April and October, to ensure that they reflect changes in the cost of supplying energy.
In April 2020, the energy price cap had been reduced causing a downward contribution from electricity, gas and other fuels of 0.20 percentage points. This fall was reversed in April 2021 with rises in gas and electricity prices. On 6 August 2021, Ofgem published the cap levels for the period from 1 October 2021 to 31 March 2022. They reported that the price cap had increased by 12% since April 2021 because of "a rise of over 50% in energy costs over the last six months with gas prices hitting a record high as the world emerges from lockdown".
Combined with the April 2021 increases, these latest rises resulted in 12-month inflation rates of 18.8% for electricity and 28.1% for gas in October 2021. In January 2022 these rates increased slightly to 19.2% for electricity and 28.3% for gas, although the overall contribution from electricity, gas and other fuels was unchanged at 0.59 percentage points. The increase in the rates for electricity and gas was because of changing energy prices in Northern Ireland, which is regulated separately from the rest of the UK and is not subject to the Ofgem price cap.
Elsewhere within housing and household services, owner occupiers' housing costs rose 2.4% on the year to January 2022 resulting in a contribution of 0.45 percentage points to the CPIH annual inflation rate. Actual rentals rose 2.3% on the year resulting in a contribution of 0.17 percentage points.
Transport
The contribution from transport has shown more variation than any other group over the last two years. It has ranged from a downward contribution of 0.20 percentage points in May 2020 during the first coronavirus (COVID-19) lockdown, to an upward contribution of 1.34 percentage points in November 2021. The contribution has since eased to 1.24 percentage points in January 2022.
Within transport, the movements have mainly been caused by changes in the price of motor fuels. Motor fuels made a downward contribution to the 12-month rate between March 2020 and February 2021, before the contribution turned positive in March 2021 and subsequently increased to 0.58 percentage points in November 2021. In January 2022 the contribution fell back to 0.50 percentage points.
Average petrol prices stood at 145.1 pence per litre in January 2022, compared with 116.6 pence per litre a year earlier. The January 2022 figure has decreased from 145.8 pence per litre in November and December 2021, which is the highest recorded average price. A year earlier, despite the re-introduction of stricter lockdowns across the UK in January 2021, average petrol prices continued to rise, increasing by 2.5 pence per litre.
The contribution from second-hand cars has also changed significantly since the beginning of 2020. Their contribution rose from a downward effect of 0.07 percentage points in January 2020 to an upward pull of 0.15 percentage points in October 2020. With the onset of the coronavirus pandemic, there were reports of increased demand as people sought alternatives to public transport. From October 2020, the contribution to the 12-month rate gradually fell back to an upward 0.01 percentage points in April 2021. It then rose again to 0.35 percentage points in January 2022, the largest contribution from second-hand cars since the start of the National Statistic series in January 2006. Used car prices have grown 28.7% since January 2021, by comparison they grew 7.8% in the year to January 2021.
These latest movements come amidst reports of increased demand as dealers opened following the national lockdown at the start of 2021, together with a global semiconductor shortage affecting the production of new cars and resulting in consumers turning to the used car market. Additionally, there are reportedly concerns in the trade about the supply of second-hand cars because of a variety of factors. These include fewer one-year-old cars coming to the market now because of a fall in new car registrations a year earlier, and the extensions of lease contracts and fewer part exchanges caused again by delays in new-car supply. The recent Prices Economic Analysis compares the growth in second-hand car prices in the UK with the euro area and United States.
Clothing and footwear
The largest upward contribution to the change in the CPIH 12-month inflation rate came from clothing and footwear, which increased the rate by 0.14 percentage points between December 2021 and January 2022. The 2.9% fall in prices in January 2022 was smaller than the 4.8% fall a year earlier. It is the smallest monthly fall for clothing and footwear prices in January since the National Statistic series began in February 2005, and the smallest since 1990 in the constructed historical series when it stood at negative 2.1%.
Prices usually fall sharply between December and January because of sales (Figure 4); prior to the coronavirus (COVID-19) pandemic, between 2016 and 2020, the average monthly fall in January was 3.8%. Therefore, the 2021 monthly fall of 4.8% was slightly higher than usual, and the 2022 monthly fall of 2.9% was slightly lower than usual.
Between November 2020 and January 2021, there was increased discounting compared with other years. By contrast, in January 2022, we have seen less discounting. The unseasonal price rise into December 2021, followed by a shallower than usual fall in January 2021, matches the pattern seen in the 2021 summer sales. There was an unseasonal rise in prices in June 2021 followed by a smaller than usual drop in prices in July 2021.
The upward pressure was spread mainly across men's and women’s garments (0.04 and 0.05 percentage points respectively), and women’s footwear (0.04 percentage points), all of which saw smaller price falls in January 2022 compared with a year earlier.
Furniture and household goods
Prices for furniture and household goods fell by less in January 2022 than in the same month a year earlier. This added 0.04 percentage points to the overall CPIH 12-month inflation rate. Prices fell by 0.5% on the month, compared with a fall of 1.6% a year ago. The effect was mainly concentrated in glassware, tableware and household utensils (0.03 percentage points), with a further 0.01 percentage points coming from tools and equipment for house and garden. In both cases prices rose on the month to January 2022, but fell in the same month a year earlier.
On the whole the annual rate for this division has been increasing since January 2021, when it stood at 1.0%. It currently stands at 8.5%, which is the highest recorded rate for this division since the start of the National Statistic series in January 2006 and also the highest recorded rate since the start of the historical modelled data series in January 1989.
Housing and household services
Housing and household services added 0.06 percentage points to the CPIH 12-month inflation rate in January 2022, with the effect coming principally from rents. This was split between owner occupiers’ housing costs (0.04 percentage points) and actual rentals (0.02 percentage points). Owner occupiers’ housing costs are discussed in more detail in Section 5. Actual rentals saw increases of 0.3% on the month, compared with 0.1% a year earlier.
There was also a small upward contribution to change from electricity, gas and other fuels of 0.01 percentage points (the contribution to change is not equal to the difference in the contributions to the rate because of rounding). This was because of rising energy prices in Northern Ireland, which has a different regulatory structure. Northern Ireland is therefore not affected by the Office for Gas and Electricity Markets (Ofgem) price cap, which came into effect in October 2021.
Restaurants and hotels
The largest offsetting downward contribution to the change in the CPIH 12-month inflation rate came from restaurants and hotels, which decreased the rate by 0.09 percentage points between December 2021 and January 2022. This was driven by accommodation services, which contributed negative 0.11 percentage points to the change, and was partially offset by catering services which added 0.02 percentage points to the annual rate.
It should be noted, however, that many items within this division were unavailable in January 2021 because of lockdowns that were in place across the UK. Unavailable items were imputed as described in Coronavirus and the effects on UK prices. This means that monthly movements in the previous year reflect imputed index movements, and should therefore be interpreted with caution.
Transport
There was a further offsetting downward contribution to the change in the CPIH 12-month inflation rate from transport, which decreased the rate by 0.06 percentage points between December 2021 and January 2022. Despite providing a large contribution to the annual rate itself this month, that contribution fell from 1.29 percentage points in December 2021 to 1.24 percentage points in January 2022 (differences are because of rounding).
This was mostly because of motor fuels, where prices fell 0.5% on the month to January 2022 but increased by 2.1% in the same month a year earlier. This led to a decrease of 0.06 percentage points in the annual rate. Elsewhere within transport, small upward contributions from second-hand cars, and spare parts and accessories were offset by similar small downward contributions from various transport services. Many items within transport services were unavailable in January’s lockdown in 2021, and were therefore imputed in line with the procedures described in Coronavirus and the effects on UK prices. This means that the monthly movements in January 2021 are imputed and should therefore be interpreted with some caution.
Read the full report at
https://www.ons.gov.uk/economy/inflationandpriceindices/bulletins/consumerpriceinflation/latest