Impact Of Increased Cost Of Living On Adults Across Great Britain: September 2022 To January 2023
21st February 2023
In this article, we have identified groups experiencing some form of financial vulnerability. In the latest pooled period, 14 September 2022 to 8 January 2023, we found.
renters had higher odds of experiencing some form of financial vulnerability (4.4 higher odds), compared with those who own their home outright; more than half (55%) of renters reported being unable to afford an unexpected, but necessary, expense of £850, compared with 12% of outright homeowners.
adults aged 25 to 34 years had the highest odds of experiencing some form of financial vulnerability (2.2 higher odds), compared with those aged 75 years and over; around a third of adults aged 25 to 34 years (34%) reported borrowing more money or using more credit than usual compared with a year ago, compared with 7% of those aged 75 years and over.
parents living with dependent children aged 0 to 4 years and aged 5 years and over had higher odds of experiencing some form of financial vulnerability (3.5 and 4.1 higher odds respectively), compared with non-parents or parents not living with dependent children; around half (54%) of parents living with a dependent child reported being unable to save in the next 12 months, compared with 4 in 10 (42%) non-parents, or parents not living with a dependent child
adults with a personal annual income of £10,000 up to £15,000 had the highest odds of experiencing some form of financial vulnerability (4.3 higher odds), compared with adults earning £50,000 or more per year; a higher proportion of adults earning £10,000 up to £15,000 per year reported being unable to save in the next 12 months (56%), compared with 24% of those earning £50,000 or more per year.
adults who pay for their gas or electricity through prepayment meters were almost twice as likely to report using credit more than usual, through things such as credit cards and loans, because of the increases in the cost of living (26%), than those who do not pay for their gas and electricity through a prepayment method (14%).
Cost of living increases and actions taken
Our Public opinions and social trends, Great Britain bulletin found that during the latest survey period, 25 January to 5 February 2023, over 9 in 10 (94%) adults reported their cost of living had increased compared with a year ago. A lower proportion (69%) reported an increase over the last month.
The most commonly reported reasons given by adults for the rise in their cost of living during this period were related to increases in the price of their food shop (95%), their gas or electricity bills (73%) and the price of their fuel (39%).
When asked what they were doing because of increases in the cost of living, around 7 in 10 (69%) adults said they were spending less on non-essentials, while 60% said they were using less fuel, such as gas or electricity in their home. These were the most commonly reported actions by all adults across Great Britain.
Throughout the rest of this article, we have used a larger pooled dataset covering 14 September 2022 to 8 January 2023 (the "latest pooled period"), to explore how the rising cost of living is impacting different groups of the population.
Using less fuel, such as gas or electricity in home
In April 2022, the energy price cap was increased, meaning households were paying more for their energy use. The government's Energy Bills Support Scheme and the Energy Price Guarantee came into effect in October 2022, that may have affected the behaviours of individuals in this pooled dataset.
In addition to government support to limit household expenditure on energy bills, some groups were more likely to say they were using less gas or electricity in their home because of the increased cost of living, with 62% of all adults selecting this in the latest pooled period.
Similar to findings reported in our article looking at the actions people are taking because of the rising cost of living, we found those more likely to report using less gas or electricity in their home included:
around 7 in 10 adults aged 55 to 64 years (72%) and 65 to 74 years (70%), compared with 40% of those aged 16 to 24 years
homeowners and those paying off a mortgage (66% and 64% respectively), compared with 55% of renters
two-thirds (66%) of parents living with dependent children aged 5 years and over, compared with 61% of non-parents or parents not living with dependent children
two-thirds (66%) of adults who do not pay for their gas or electricity through a prepayment meter, compared with 54% of those who pay for their energy through such means.
Using credit more than usual
With the cost of living rising, 15% of adults reported borrowing more than usual by using credit cards, their overdraft, or taking out a loan. While loans can provide short-term financial security, the increased use of credit can pose longer-term challenges for households.
Adults aged 25 to 34 years and 35 to 44 years were more likely to report having to use credit more than usual (26% and 23%, respectively) because of the increased cost of living, compared with both their younger and older counterparts.
A higher proportion of adults living in the most deprived areas of England also reported having to use credit more than usual (19%), compared with those in the least deprived areas (11%). Renters were four times more likely to report this action (22%), compared with adults who own their home outright (5%).
Parents living with dependent children were more likely to report using credit more than usual because of the rising cost of living (27%), compared with non-parents or parents not living with dependent children (12%). This higher rate appears to be driven by parents living with younger children (aged 0 to 4 years), with 30% selecting this action.
Adults who pay for their gas or electricity through prepayment meters were almost twice as likely to report using credit more than usual (26%) than those who do not pay for their gas and electricity through a prepayment method (14%).
Characteristics associated with financial vulnerability
In our March 2022 article, we explored the characteristics associated with not being able to afford an unexpected, but necessary, expense of £850. In this article, we have expanded our measure of financial vulnerability to include three additional questions.
In the latest pooled period, we found that around a quarter (23%) of adults experienced some form of financial vulnerability. In this article, a person is considered to have experienced some form of financial vulnerability if three or more of the following applied to them:
being unable to afford an unexpected, but necessary, expense of £850
borrowing more money or using more credit than usual, in the last month, compared to a year ago
being unable to save in the next 12 months
finding it very or somewhat difficult to afford energy bills
This section presents findings from a logistic regression, that assesses the likelihood of having some form of financial vulnerability, after controlling for the following characteristics:
age group
sex
region (including Wales and Scotland)
disability status
ethnicity
employment status
personal annual income
highest education level
housing tenure
parental status
household composition
After controlling for these characteristics, we found all factors to be associated with financial vulnerability, although no significant association was found for ethnicity. This section explores some of these findings in more detail, with further data available in the accompanying dataset.
Personal annual income
After controlling for a range of characteristics, lower income groups were found to have some of the highest odds of experiencing some form of financial vulnerability. Adults with a personal income of £10,000 up to £15,000 per year had over four times higher odds of experiencing some form of financial vulnerability (odds ratio equals 4.3) than adults with an income of £50,000 or more per year. Adults in all other annual income groups below £50,000 were also significantly more likely to experience some form of financial vulnerability than adults with an income of £50,000 or more per year.
Housing tenure
After controlling for a range of characteristics, renters had over four times the odds of experiencing some form of financial vulnerability (odds ratio equals 4.4) when compared with those who own their home outright. Adults in all other housing tenure groups also had higher odds and were therefore more likely to experience some form of financial vulnerability when compared with homeowners.
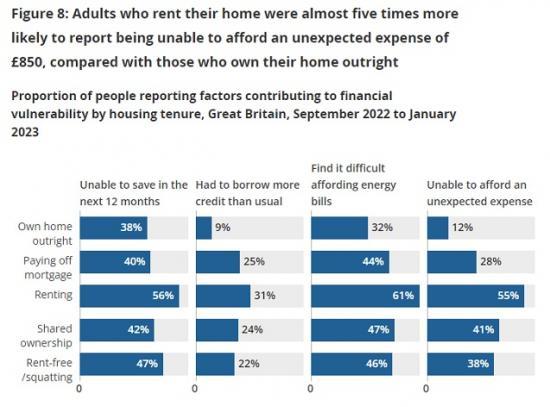
When looking at the measures that contribute to financial vulnerability, we found that:
adults renting their home were over four times more likely to report being unable to afford an unexpected expense of £850 (55%), compared with those who own their home outright (12%), and around twice as likely compared with those who are paying off a mortgage (28%)
renters were also more likely to report borrowing more money or using more credit than usual compared with a year ago (31%), compared with outright homeowners (9%) and those paying off a mortgage (25%)
a higher proportion of adults who rent their home reported being unable to save in the next 12 months (56%), compared with those who own their home outright (38%) and those who are paying off a mortgage (40%)
finding it difficult affording energy bills was also more common for renters who are responsible for paying these bills (61%) compared with outright homeowners (32%) and those with a mortgage (44%)
Parental status
After controlling for a range of characteristics, parents living with dependent children aged 5 years and over had odds four times higher of experiencing some form of financial vulnerability (odds ratio equals 4.1) than non-parents or parents not living with dependent children. Parents living with younger dependent children had odds three times higher (odds ratio equals 3.5).
When looking at the measures that contribute to financial vulnerability, we found that:
being unable to afford an unexpected expense of £850 was most commonly reported by parents living with a dependent child aged 0 to 4 years (47%) and aged 5 years or over (42%), compared with just over a quarter (28%) of non-parents or parents not living with a dependent child
parents living with a dependent child aged 0 to 4 years and aged 5 years or over were more likely to report borrowing more money or using more credit than usual compared with a year ago (36% and 34%, respectively), compared with non-parents or parents not living with a dependent child (18%)
a higher proportion of parents living with a dependent child aged 0 to 4 years and aged 5 years or over reported being unable to save in the next 12 months (56% and 53% respectively), compared with 42% of non-parents or parents not living with a dependent child
parents living with a dependent child aged 0 to 4 years and aged 5 years or over who were responsible for paying energy bills were more likely to report finding it difficult affording them (58% and 56%, respectively), when compared with non-parents or parents no living with dependent child (42%)
Note
To read the full ONS report go HERE