UK Trade - December 2023
15th February 2024
The value of goods imports decreased by £2.6 billion (5.4%) in December 2023, with falls in imports from both EU and non-EU countries, primarily driven by decreased imports of fuels.
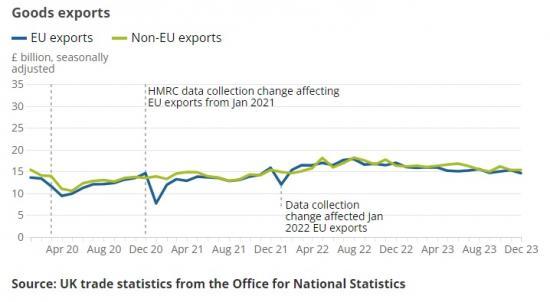
The value of goods exports decreased by £0.7 billion (2.2%) in December 2023, because of lower exports to the EU.
The total trade in goods and services deficit widened by £6.2 billion to £14.9 billion in Quarter 4 (Oct to Dec) 2023, because of a large fall in exports of services.
The trade in goods deficit widened by £1.4 billion to £49.9 billion in Quarter 4 2023, while the trade in services surplus is estimated to have narrowed by £4.8 billion to £34.9 billion.
Total imports of goods and services fell slightly in 2023, while annual total exports rose by £36.8 billion (4.6%), which saw the total annual trade balance narrow by £36.7 billion to a deficit of £53.0 billion.
Monthly trade in goods
Total imports of goods in "current prices", which are not adjusted for inflation (explained in Section 10: Glossary), decreased by £2.6 billion (5.4%) in December 2023. Imports from non-EU countries fell by £1.5 billion (7.4%), and imports from the EU fell by £1.0 billion (3.9%) (Table 1 and Figure 1).
Total exports of goods decreased by £0.7 billion (2.2%) in December 2023, because of a £0.7 billion (4.5%) fall in exports to the EU while exports to non-EU countries remained stable.
Imports from the EU were £6.4 billion higher than from non-EU countries in December 2023, while exports to the EU were £0.7 billion lower than exports to non-EU countries.
After removing the effect of inflation by calculating "chained volume measures" (explained in Section 10: Glossary), total goods imports decreased by £1.4 billion (3.6%) in December 2023 (Figure 2). Imports from non-EU countries fell by £0.7 billion (4.5%) and imports from the EU also fell by £0.7 billion (3.0%).
Total goods exports fell by £0.1 billion (0.5%) in December 2023, after the effect of inflation is removed. This was because exports to the EU decreased by £0.4 billion (3.2%) while exports to non-EU countries increased by £0.3 billion (2.1%).
Goods imports
Imports from the EU decreased by £1.0 billion (3.9%) in December 2023. This was mainly because of a £0.6 billion fall in imports of fuels, while smaller falls were seen across all other commodities (Figure 3). The fall in imports of fuels was because of decreased imports of refined oil from the Netherlands.
Imports from non-EU countries decreased by £1.5 billion (7.4%) in December 2023. This was mainly because of a £0.7 billion fall in fuel imports and a £0.4 billion fall in imports of machinery and transport equipment. The fall in imports of fuels was because of decreased imports of crude oil from Norway, while the fall in imports of machinery and transport equipment was because of lower imports of electrical machinery from China.
While there has been recent disruption to shipping in the Red Sea, with ships re-routing around the Cape of Good Hope, as explained in the BBC News article, What do Red Sea assaults mean for global trade?, there is no evidence that this has affected imports in December 2023. Our Weekly shipping indicators dataset shows that there was a decrease in the number of cargo and tanker ship visits in December 2023 compared with November. However, this reflects a general slowdown in shipping over the festive period as observed in previous years. We will continue to monitor the impact of the disruption in the Red Sea in future releases.
Goods exports
Exports to the EU decreased by £0.7 billion (4.4%) in December 2023, because of a £0.3 billion fall in fuel exports and £0.1 billion falls in exports of both chemicals, and machinery and transport equipment (Figure 5). The fall in fuel exports was primarily driven by a decrease in exports of crude oil to Poland.
Exports to non-EU countries remained stable in December 2023. Exports of material manufactures decreased by £0.5 billion, which was offset by an increase of £0.4 billion in fuels exports and a £0.1 billion increase in exports of machinery and transport equipment. The fall in exports of material manufactures was driven by reduced exports of non-ferrous metals to the United States, while the increase in fuel exports was because of increased exports of crude oil to South Korea.
Read the full ONS report HERE