Universal Credit - Incomes, Incentives And The Remaining Roll-out
11th June 2024
What has been the impact of universal credit on incomes and work incentives?. What challenges remain for the next government?
A report by the Institute for Fiscal Studies.
The introduction of universal credit (UC) has been the most significant reform to the working-age benefits system since the reforms following the post-war Beveridge Report.
When fully rolled out, around 8 million families - 29% of all working-age families - will be entitled to the benefit. UC is an integrated means-tested benefit that is replacing six ‘legacy' benefits, combining out-of-work support with support for housing costs, incapacity and children.
This report assesses the impact of the UC reform on households' incomes and their financial incentives to work, as well as the practical experience of applying for and getting means-tested benefits. We then briefly review the issues around the rest of UC's roll-out.
Key findings
Nearly half (47%; 3.7 million) of all households affected by the UC reform gain at least £200 per year. One-fifth of affected households (21%; 1.7 million) see their income change by less than £200 per year, while nearly a third (32%; 2.5 million) are worse off by at least £200 per year.
Many see considerably more substantial income changes. 25% (2.0 million) of affected households are better off under UC by at least £2,000 per year, with half of those better off by more than £4,000 per year. Conversely, 21% of affected households (1.6 million) are worse off under the legacy system by at least £2,000 per year, with close to half of those worse off by more than £4,000.
Couples with children are the most likely to gain under UC compared with the legacy system. 72% gain by at least £200 a year, compared with just 22% who lose out by at least that much. Households in work and renter households also tend to gain as benefits are typically withdrawn more slowly as earnings rise under UC.
Most households with one adult above and one adult below state pension age are significantly worse off under the UC system than under legacy benefits. Because the reform means they are entitled to UC - rather than the much more generous pension credit - 70% of these households (180,000) lose out by more than £4,000 per year under the UC system. Households with over £16,000 of assets and the self-employed can also lose out significantly under the UC system.
Households receiving health-related benefits also see big differences in their benefit income under UC compared with legacy benefits. Depending on the exact combination of disability and incapacity benefits they receive, a household could be either better or worse off by thousands of pounds per year.
Taken as a whole, UC represents a net giveaway of about £2½ billion compared with the legacy system. Households in the second to fourth income deciles benefit most on average, while middle-income households are worse off.
A key motivation for introducing UC was to strengthen work incentives, and for many workers it does so (often significantly). Under the legacy system, claimants could see multiple benefits withdrawn at once as their earnings increased, leading to very high effective tax rates. For example, about a quarter of workers lost at least 70% of their earnings in higher taxes and lower benefit entitlements when they moved into work. Under UC, almost no one sees an effective tax rate that high.
Similarly, UC induces substantial falls in the share of workers who are strongly disincentivised from increasing their earnings (e.g. by working an extra hour). However, by extending entitlements to benefits further up the income distribution, UC brings more workers into means-testing and hence weakens work incentives for many who under the legacy system had a low effective tax rate. While the incentive to move into paid work has been strengthened, there has been almost no change in the incentive to move from part-time to full-time work.
While UC has made significant strides in rationalising the benefit system, there is still room for improvement. In particular, integrating council tax support into UC would mean practically no workers facing a marginal tax rate above 75% (down from 6%).
UC also changes the practical experience of getting the benefit. For many, it eases the burden of applying and allows the system to respond more flexibly to changes in families' circumstances. It also results in fewer over- and under-payments than the legacy system. However, various factors likely make budgeting harder: it can (usually) only be received monthly, payments cannot be split between couples nor paid directly to landlords, and when applying for the benefit claimants face a ‘five-week wait' for the first payment, which applicants must cover either through their own resources or a loan (‘advance') from the Department for Work and Pensions (DWP) that must be repaid.
The roll-out of UC is now planned to be completed by the end of 2025. There are still around 1.2 million claimants of legacy benefits who must be migrated. This requires them to make an application for UC after receiving a ‘migration notice' telling them to do so. 32% of tax credit recipients who received a migration notice in 2023-24 did not apply in time and saw their benefit payments terminated. If this rate persisted for the remaining migrations, then 400,000 claimants would see their benefit payments stop.
The largest group left to be migrated are claimants of employment and support allowance (ESA), a particularly vulnerable group who may face even more acute difficulties with putting in a UC claim. DWP has already pledged additional support to help these claimants, but getting this assistance right will be a critical issue for the next government - or large numbers of disabled claimants, often receiving over £10,000 a year in means-tested benefits, may suddenly end up without any of that financial support.
1. What is universal credit?
The introduction of universal credit (UC) has been the most significant reform to the working-age benefits system since the reforms following the post-war Beveridge Report. UC is a benefit for working-age families with low incomes. When it is fully rolled out, at any one time around 8.2 million families - 29% of all working-age families - will be entitled to UC1 . This will include 4.5 million workless families and another 3.6 million in-work families. Many more will be entitled at some point over their life. For some types of families, even those with substantial earnings can be eligible for UC - families with two children in rented accommodation may be entitled to UC if a single earner is on up to around £70,000, and if in rented accommodation in expensive areas such as London they could be entitled while earning more than £100,000. It is an integrated benefit, replacing six existing means-tested benefits and tax credits (known as the ‘legacy' system2 ), and includes support for rental costs, incapacity and children. The change to UC aimed to simplify the system of means-tested benefits, making it easier to interact with and reducing the number of benefit recipients facing very high marginal tax rates on earnings.
UC started to be rolled out to benefit recipients in 2013. While initially planned to be completed by 2017-18, this roll-out is still ongoing (Office for Budget Responsibility, 2012). As of February 2024, there were 5.0 million families receiving UC (Department for Work and Pensions, 2024). Meanwhile, there are approximately 1.2 million claimants still receiving legacy benefits, who are due to be migrated over to UC by the end of 2025 (Child Poverty Action Group, 2024).
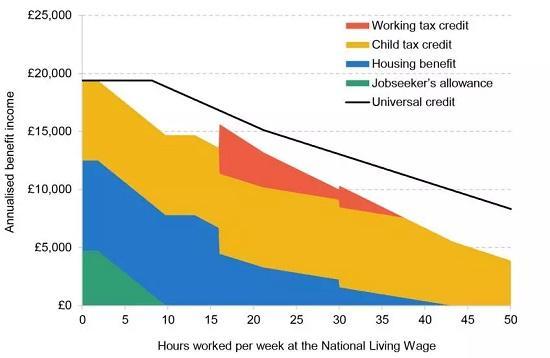
Figure 1 shows annualised benefit entitlements under the UC and legacy systems for an example lone-parent renter, under the UC system and the legacy system3 . Although – as we will come onto later – out-of-work families can see their entitlements rise or fall when they move from the legacy system to UC, the typical non-disabled claimant without significant savings (such as our example lone parent) receives the same amount under the UC system as under the legacy system (although in the latter case they would have to claim multiple benefits to get their full entitlement). The differences occur when in work. 55p of UC is withdrawn for every £1 of after-tax earnings above a threshold, known as the work allowance.4 By contrast, under the legacy system, each benefit had its own rules for means-testing. While the amount of UC the individual receives falls smoothly as they work more, their benefit income under the legacy system follows a rather more bumpy path. Initially, benefit income is withdrawn with a 100% taper rate above a very small disregard (i.e. benefits fall by £1 for every £1 earned); benefit entitlements then jump up at 16 hours when the individual becomes eligible for working tax credits, and they jump up again at 30 hours when they become eligible for a ‘full-time premium'.
Figure 1. Annualised benefit income for an example lone-parent renter with two children earning the National Living Wage
It is worth noting – as this is sometimes a point of confusion – what the UC reform is not. There have been a number of other changes to the working-age benefit system since the introduction of UC, including the introduction of the two-child limit and benefit cap, along with the freeze to working-age benefits between 2015 and 2019. These reforms and others have generally been applied in the same way to both the UC and legacy systems, and so are not part of the UC reform itself. There have been changes specific to UC since its introduction, including cuts and increases to work allowances (the amount some recipients can earn before their UC starts to be withdrawn) and two reductions in the taper rate (the rate at which UC is withdrawn). These did not have any parallel in the legacy system. Our goal is to assess the UC system in 2024–25, incorporating all changes implemented to date.
In this report, we model the impact of the universal credit reform on household incomes. To do this, we compare households' incomes under two systems. The first assumes that UC is fully rolled out, meaning all families are assessed under the current UC system. The second assumes that all households are instead assessed under the current legacy system. We use TAXBEN, the IFS tax and benefit microsimulation model, along with household information from the Family Resources Survey (FRS) 2022–23 to compute households’ incomes under each system5 . We assume full take-up of benefits, meaning we do not account for potential effects of the UC reform on benefit take-up. This is potentially important, since it is possible that by combining multiple benefits UC may increase take-up – though it is also possible that UC will be associated with a stigma that tax credits were not associated with, reducing take-up. In either case, there is no existing evidence we are aware of on the impact of UC on take-up. We also do not account for any behavioural response, such as impacts on hours worked.
2. Who wins and loses under universal credit?
We have already seen in Figure 1 that the UC reform can have significant effects on benefit entitlements. In this section, we turn to quantifying these effects across the population. We first highlight the proportion of affected households gaining and losing different amounts.6 We split by household type, work status and housing tenure to help characterise the types of households left better and worse off by the changes. We briefly discuss the potential effects on families receiving health-related benefits. We then consider the average impacts across the whole income distribution.
Figure 2 shows the distribution of impacts of the UC reform for households of different compositions, as well as for all 8 million affected households.
We find that:
Nearly half (47%) of all affected households gain at least £200 per year under the reform. One-fifth of affected households (21%) see their income change by less than £200 per year, while nearly a third (32%) are worse off by at least £200 per year.
Some households see very significant gains and losses. 25% of all affected households are better off under UC by at least £2,000 per year, with half of those better off by more than £4,000 per year. Conversely, 21% of affected households are worse off than under the legacy system by £2,000 per year or more, with close to half of those worse off by more than £4,000. For context, average annual household income among all affected households is £34,000 per year, meaning that, for a substantial fraction of affected households, these changes represent a very big change to their income.
Couples with children are the most likely to gain under the UC system, with 72% better off by at least £200 per year and only 22% worse off by £200 or more. Under UC their benefits are generally withdrawn more slowly, because all benefit income is tapered away at a single rate (above a work allowance of £4,848 to £8,076 per year), whereas under the legacy system multiple benefits were withdrawn simultaneously. This means that they tend to be better off under UC than under the legacy system. Conversely, most households without children have no work allowance, meaning their UC is withdrawn as soon as they start earning some income. Partly as a result of this, households with children do better under UC than those without.
Households with one adult over and one under the state pension age (SPA) – what the Department for Work and Pensions calls ‘mixed-age couples’ (MACs) – are very likely to lose out. 70% of these households lose out by more than £4,000 per year under the UC system, while 96% are worse off by at least £200. This is because under the legacy system these couples were entitled to apply for pension credit, but under UC they must instead apply for UC. Pension credit is substantially more generous than UC: a couple with no other source of income would be entitled to more than £17,300 per year in pension credit, but just £7,400 per year in UC.
Read the full report HERE
Pdf 25 Pages