Producer Price Inflation UK - June 2024 Including Services, April To June 2024
17th July 2024
Changes in the prices of goods bought and sold by UK manufacturers, including price indices of materials and fuels purchased (input prices) and factory gate prices (output prices). Also including quarterly estimates monitoring the changes in prices charged for services provided to UK-based customers for a range of industries.
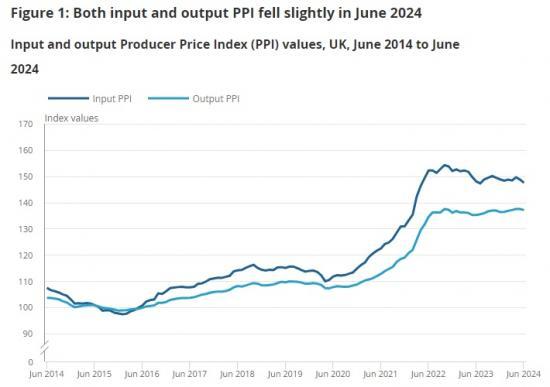
Producer input prices fell by 0.4% in the year to June 2024, up from a revised fall of 0.7% in the year to May.
Producer output (factory gate) prices rose by 1.4% in the year to June 2024, down from a rise of 1.7% in the year to May.
On a monthly basis, producer input prices fell by 0.8%, while output (factory gate) prices fell by 0.3% in June 2024.
Services producer prices rose by 3.1% in the year to Quarter 2 (Apr to June) 2024, down from a revised increase of 3.7% in the year to Quarter 1 (Jan to Mar).
Producer price inflation rates
Producer input prices fell by 0.4% in the year to June 2024, up from a revised fall of 0.7% in the year to May. Monthly input prices fell by 0.8% in June 2024, following a revised fall of 0.6% in May (Table 1).
Producer output (factory gate) prices rose by 1.4% in the year to June 2024, down from a rise of 1.7% in the year to May. Monthly output prices fell by 0.3% in June 2024, down from a revised rate of 0.0% in May (Table 1).
Estimates for both May and June 2024 are provisional, and figures for the latest 12 months are subject to revisions, as additional survey data are returned and validated. Effective response rates at time of first publishing can be found in Section 9: Strengths and limitations.
Input producer price inflation
Of the 10 product groups for the input Producer Price Index (PPI), 4 made downward contributions to the annual inflation rate in June 2024. The largest of these came from inputs of fuels (energy), inputs of other parts and equipment, and inputs of chemicals, which contributed negative 0.74, 0.50 and 0.35 percentage points, respectively (Figure 2).
Fuel prices fell by 14.5% in the year to June 2024, which is down from a fall of 10.8% in the year to May (Table 2). The main contribution to this fall came from lower electricity prices, which fell by 11.3% in the year to June 2024. Fuel covers electricity and gas (D35) and coal (B05) of the classification of products by activity (CPA 2.1).
In comparison, the largest offsetting upward contribution came from inputs of domestic food, at 0.36 percentage points. Annual food input prices increased from 0.8% in May 2024 to 1.5% in June. The main contribution came from non-perennial crops, with bad weather and limited supplies leading to increased prices.
Inputs of metals and non-metallic minerals provided the largest contribution to the change in the annual inflation rate in June 2024, with an upward contribution to the change of 0.39 percentage points. The annual inflation rate for this product group was 0.0% in June 2024, which was up from negative 1.8% in May (Table 2).
The prices of materials and fuels imported by UK manufacturers fell by 0.2% in the year to June 2024, up from a revised fall of 1.3% in the year to May. Prices fell by 0.3% between May and June 2024, compared with a revised fall of 1.2% between April and May. Sterling appreciation has been associated with falling import prices over the past year, although that effect has eased in recent months (Table 3).
Output producer price inflation
Of the 10 product groups for the output Producer Price Index (PPI), 7 made upward contributions to the annual inflation rate in June 2024. The largest of these came from refined petroleum products and "other outputs", which contributed 2.35 and 0.99 percentage points, respectively (Figure 3).
Coke and refined petroleum prices rose by 13.6% in the year to June 2024, down from 17.1% in the year to May (Table 4). Prices for "other outputs" rose by 1.7% in the year to June 2024, down from a rise of 2.2% in the year to May.
In comparison, offsetting downward contributions came from chemicals and paper products, at negative 1.37 and 1.10 percentage points, respectively. Chemical prices fell by 3.1% in the year to June 2024 (Table 4). This decrease was primarily caused by fertiliser prices.
Petroleum products made the largest contribution to the change in the annual inflation rate in June 2024, with a downward contribution of 0.26 percentage points.
Read the full article with more links and graphs HERE