Public Sector Finances Uk - July 2024
21st August 2024

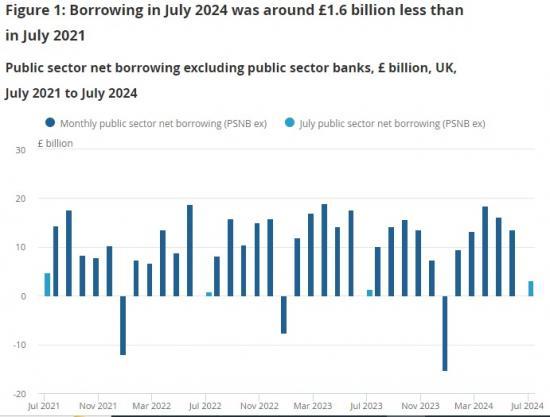
Borrowing - the difference between public sector spending and income - was £3.1 billion in July 2024, £1.8 billion more than in July 2023 and the highest July borrowing since 2021.
Self-assessed income tax (SA) receipts in July 2024 were £12.9 billion, £1.1 billion more than in July 2023; however, because of the possibility of delayed July payments, we recommend considering July and August SA receipts as a whole when making year-on-year comparisons.
Borrowing in the financial year to July 2024 was £51.4 billion, £0.5 billion less than in the same four-month period a year earlier but the fourth highest year-to-July borrowing since monthly records began in January 1993.
Public sector net debt excluding public sector banks was provisionally estimated at 99.4% of gross domestic product (GDP) at the end of July 2024; this was 3.8 percentage points more than at the end of July 2023, and remains at levels last seen in the early 1960s.
Excluding the Bank of England, debt was 91.9% of GDP, 4.9 percentage points more than at the end of July 2023 but 7.5 percentage points lower than the wider debt measure.
Public sector net worth excluding public sector banks was in deficit by £739.9 billion at the end of July 2024, a £123.3 billion larger deficit than at the end of July 2023.
Central government net cash requirement (excluding UK Asset Resolution Ltd and Network Rail) was £29.6 billion in July 2024, £19.6 billion more than in July 2023; in July 2024, the redemption of an index-linked gilt increased central government net cash requirement by around £14.5 billion.
Borrowing in July 2024
The public sector spent more than it received in taxes and other income in July 2024, requiring it to borrow £3.1 billion, the highest July borrowing since 2021.
Initial estimates for July 2024 suggest that borrowing was £1.8 billion higher than July last year, and £3.0 billion higher than the £0.1 billion forecast by the Office for Budget Responsibility (OBR).
In July and January, accrued receipts are usually high because of receipts from self-assessed income taxes (SA). These additional receipts reduce borrowing, which is generally low in July.
Central government borrowing
Central government forms the largest part of the public sector and includes HM Revenue and Customs, the Department of Health and Social Care, the Department for Education, and the Ministry of Defence.
The relationship between central government's receipts and expenditure is an important determinant of public sector borrowing. In July 2024, central government borrowed £16.5 billion, £1.9 billion more than in July 2023.
Central government receipts
Central government's receipts were £91.0 billion in July 2024, £1.7 billion more than in July 2023. Of this £1.7 billion increase in revenue:
central government tax receipts increased by £2.1 billion to £71.2 billion, with increases in Income Tax, Corporation Tax and Value Added Tax (VAT) receipts of £1.7 billion, £0.3 billion and £0.2 billion, respectively
compulsory social contributions decreased by £1.1 billion to £13.8 billion, largely because of the reductions in the main rates of National Insurance in 2024
In July 2024, SA receipts were £12.9 billion, which is £1.1 billion more than in July 2023 but £0.7 billion less than the £13.6 billion forecast by the OBR.
As well as primarily affecting July receipts, the revenue raised through SA taxes also tends to lead to higher receipts in August, although to a lesser extent. This is because any delayed July payments will be recorded as August receipts. We recommend considering July and August SA receipts together when making year-on-year comparisons.
A detailed breakdown of central government income is presented in our Public sector current receipts: Appendix D dataset.
Central government expenditure
Central government spending data for July 2024 are provisional. There is uncertainty around these estimates until more detailed departmental information becomes available later in the year.
Central government's total expenditure was £107.4 billion in July 2024, £3.5 billion more than in July 2023. Of this overall £3.5 billion increase in spending:
net social benefits paid by central government increased by £2.7 billion to £25.9 billion, largely because of inflation-linked benefits uprating
central government departmental spending on goods and services increased by £1.3 billion to £35.7 billion, as inflation and pay rises increased running costs
payments to support the day-to-day running of local government increased by £2.4 billion to £13.9 billion; being both central government spending and a local government receipt, these intra-government transfers have no impact on overall public sector borrowing
central government net investment decreased by £1.6 billion to £17.2 billion, partly because of regular payments from HM Treasury to the Bank of England Asset Purchase Facility Fund (APF), which decreased by £2.1 billion compared with a year earlier; being both central government spending and a Bank of England receipt, these intra-public sector transfers have no impact on overall public sector borrowing but do affect our public sector net borrowing excluding the Bank of England (PSNB ex BoE) measure
interest payable on central government debt decreased by £1.0 billion to £7.0 billion, largely because the interest payable on index-linked gilts rises and falls with the Retail Prices Index (RPI)
Interest payable on central government debt
In July 2024, the interest payable on central government debt was £7.0 billion. This was the second highest interest payable in any July since records began (for this component), in 1997.
Read the full ONS report HERE
