The Surprising Truth About Why Wealth Inequality Hasn't Risen - And The Less Surprising Reality That Britain Is Still Unfair
7th December 2024

"The rich are getting richer and the poor are getting poorer" is a slogan of at least 200 years' standing, and one that feels apt in today's Britain of burgeoning foodbanks and bumper executive bonuses.
Indeed, most people who worry about wealth inequality would take it as read that it's been getting worse. But look carefully at the wealth data - as a new RF report by one of us does — and you're in for a surprise.
Whether you look at the top 1 per cent's share of all assets, the 10 per cent's share or summary statistics such as the Gini, the inequality of wealth looks flat as a pancake.
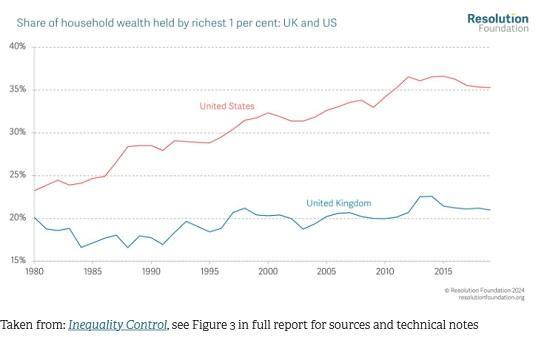
The share of top 1 per cent in household wealth has inched up by only a single percentage point since 1980. This position is very different from the US - where the very rich grabbed an additional 12-point share in parallel (see chart). The wealth gap story is very different, too, from the path of British incomes, which really did get much more unequal in the 1980s.
So can we relax? Not at all: indeed, the other one of us has also released a separate report detailing the warping power of wealth over our society, for example in stifling opportunity for poorer youngsters. While it could seem like there’s a contradiction here, Britain’s main problem has not been the rise of wealth inequality, but simply the rise of wealth. Throughout the post-war era, the value of households’ assets was usually around three times national income; since 1980s they have swollen to twice that much.
In the last few years, this ratio has swung around dramatically. First, wealth surged to new heights in the pandemic. Interest rates plunged to record lows, boosting house prices and pushing up the "snapshot" value of accrued pensions by raising the capital required to buy any given income. Then, more recently, rising rates prompted a rapid reversal on both fronts, at one point knocking an extraordinary £2 trillion from total household wealth. And yet through these dramatic recent ups and downs, the big picture remains: the wealth-to-income ratio is still about twice what it was before 1980.
Bigger wealth makes life more unequal even when wealth inequality isn’t rising, because wealth is always and everywhere more unequal than income: roughly twice as unequal in fact. Typical estimates of the summary Gini statistic, which is expressed on a 0 to 100 scale, is around 35 for British incomes but nearly 70 for British wealth. This huge differential makes intuitive sense - virtually everyone has some sort of income, even if only from benefits. But with wealth, some people sit on unimaginable fortunes, while others have no meaningful assets at all, and sometimes even negative wealth (ie debt). And this difference is perennial. So when wealth becomes relatively more important, life really gets more unequal, even if the distribution of wealth itself doesn’t change.
Another way to think about this is to think about what happens to the absolute gap between relatively richer and relatively poorer families as the scale of wealth increases. Back in 2006, the average value of wealth for an adult in the top-tenth bracket was £1.1 million more (in today’s money) than that for someone roughly in the middle. Today, despite that very recent fall in aggregate wealth as interest rates have risen, that same gap has increased to £1.3 million.
What’s more is that, underneath that headline of stable overall inequality, the distribution has been changing - and in ways that do poor and middling younger people no favours. Being of different ages - one of us is 30, the other 48 - we sense from comparing the experiences of our respective friends and contemporaries that family wealth is having an increasing bearing on who does and doesn’t get to buy a home.
The detailed wealth data helps us make sense of this. 30-somethings at the dawn of the pandemic had around 30 per cent less real personal (rather than family) wealth to draw on than did the 30-somethings of the financial crisis years. Moreover, within the younger generations, wealth has been getting more unequal.
The stable overall inequality figures are explained instead by developments at the other end of the age range. Among pensioners, as time has gone by there are more homeowners than in the past, which has helped push their typical wealth levels up by 50 per cent in real terms between the financial crisis and the pandemic. The swelling of the "own-something" older middle class has worked to push inequality among the over-60s down. Seeing as most wealth is owned by older people – the ones who have had a time to build up assets for retirement – this bears heavily on the overall numbers. But, especially for the young, these trends do nothing to counter their experience of British life as unfair.
So, those soothing headline statistics reporting stable inequality of wealth are less comforting than they seem. A peak beneath the bonnet reveals ample reason to worry about the level and distribution of wealth across the country, and across generations – and its effects on the way we live now.
Read the full Resolution Foundation Inequality Report HERE
Pdf 52 Pages
