2008 Scottish Farm Income Estimates
1st February 2009
Scotland's Chief Statistician has published the Aggregate Estimates for Total Income from Farming (TIFF) for 2008 and the Estimates of Average Net Farm Income (NFI) for 2007-08.
The statistics show that total income from farming decreased by Ł11.9 million in 2008 to Ł629.6 million, a fall of 1.8 per cent over the previous year before inflation is taken into account. In real terms, this represents a fall of 5.6 per cent.
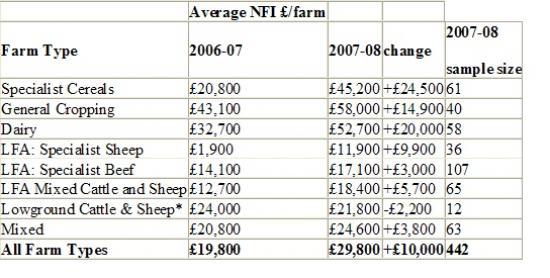
Separate figures on average Net Farm Incomes (NFI) show an increase of Ł10,000 from Ł19,800 in 2006-07 to Ł29,800 in 2007-08.
SECTION A: Aggregate Estimates - Total Income from Farming (TIFF)
The aggregate estimates for 2008 are provisional, and are based on the latest information that is available towards the end of 2008. A final position relating to some components is not available until later in the year, therefore the 2008 figures must be treated as estimates.
In 2008, the value of Outputs has risen by Ł187.3 million (8.8 per cent), whilst the value of Inputs have increased by Ł216.6 million (16.7 per cent). Other Costs to farmers have fallen by Ł7.1 million (1 per cent) and the value of de-coupled Payments and Subsidies has increased by Ł10.4 million (1.9 per cent). These factors combine to produce an overall decrease in Total Income From Farming of Ł11.9 million (1.8 per cent).
The underlying details of this, focusing on the main changes between 2007 and 2008 are presented below.
Outputs from Scottish farms
The value of gross output has increased by Ł187.3 million (8.8 per cent) in 2008. This is primarily due to increases in output values for cereals, finished cattle and other livestock products (milk and eggs).
Cereals
The value of cereals rose in 2008 by Ł52.1 million (15.6 per cent), reflecting a higher cereal harvest and high prices in the early part of the year. Most of this increase was in wheat, with a rise of Ł33.8 million (35 per cent), with barley also increasing by Ł20.4 million (9.1 per cent).
Other Crops
This sector has decreased by Ł29.9 million, driven by a decrease of Ł18 million (8.6 per cent) in potatoes, due mainly to a lower harvest and a fall in the average price for ware potatoes from the 2008 crop. Oilseed rape value decreased by Ł8.6 million (22.5 per cent), due to reductions in area and production whilst other arable crops also showed a decrease in 2008.
Horticulture
The overall value of horticulture has increased by Ł3.6 million (1.7 per cent). This is mainly due to increases of Ł7.9 million (8.5 per cent) in vegetables, reflecting higher prices, and Ł5.3 million (8.5 per cent) in soft fruit, reflecting increased areas and production. These increases were offset by a decrease in the output value of flowers and nursery stock in 2008 of Ł9.6m or 17.1 per cent, due a reduction in areas and production.
Finished livestock made up the bulk of the increases in 2008 output values, with increases evident across all finished livestock sectors. These increases were driven primarily by increased prices for livestock in 2008. Overall, finished livestock values increased by Ł94.0 million (14.1 per cent) in 2008, with the majority of this rise coming from the value of finished cattle and calves, which increased by Ł76.8 million (19.7 per cent). There was also a rise in finished sheep values of Ł6.9 million or 5.3 per cent. Increases were also observed in the pig sector of Ł4.0 million (7.1 per cent) and the poultry sector output values also rose by Ł6.0 million (8 per cent).
Store livestock values also increased in 2008 by Ł6.2 million (11.7 per cent). The biggest contributor to this increase was the store cattle category which rose by Ł3.5 million (10.9 per cent), again due to an increase in prices for store cattle.
The value of livestock products also increased notably by Ł51.8 million (17.2 per cent) in 2008. This was primarily driven by an increase in the average price per litre for milk which resulted in an overall rise in the output value for milk and milk products of Ł40.1 million (15.3 per cent). The output value of eggs for food also increased by Ł11.2 million (35.4 per cent).
Input costs faced by Scottish farmers
Gross input costs increased in 2008 by Ł216.6 million (16.7 per cent).
The rise in input costs is attributable to three main areas; (i) increases in fertilisers and lime costs of Ł72.1 million (a rise of 50.5 per cent); (ii) higher feedstuff costs, up by Ł69.9 million (a rise of 18.5 per cent) and increases in fuel and oil costs of Ł37.1 million (a rise of 48.7 per cent). There were large price increases for all of these inputs and the higher crop areas also contributed to increased costs for fertilisers and fuel.
Higher crop areas also contributed to increases in the cost of seeds of Ł8.7 million (16.2 per cent) and crop protection costs rose by Ł9.8 million (17.4 per cent). Other farm costs also increased by Ł9.4 million (3 per cent).
Other Costs faced by Scottish Farmers
The value of interest payments on bank advances and other loans decreased in 2008 by Ł17.6 million (13.6 per cent) reflecting decreases in interest rates during 2008.
Hired labour costs increased in 2008 by Ł13.6 million (4.8 per cent).
Total Payments & Subsidies
The total level of decoupled payments and subsidies in 2008 was Ł551.2 million, an increase of Ł10.4 million (1.9 per cent) on the 2007 estimate of Ł540.9 million.
The Single Farm Payment (SFP) was valued at Ł431.4 million, an increase of Ł37.7 million (9.6 per cent) on 2007 levels, which was due to a more favourable exchange rate in 2008 (as SFP is initially valued in Euros). It should be noted that in 2008 a higher rate of overall modulation (12.4 per cent) was applied than in 2007 (9.3 per cent). This modulation simply reflects a percentage of SFP being 'top-sliced' and routed into EU and UK agriculture schemes.
In 2008, a reduction of Ł20.5 million is shown in other subsidies. This is due to a one-off support payment for the sheep sector that was made in 2007 (Ł20.5m) in order to counter the effects of Foot and Mouth restrictions. A reduction of Ł7.8 million in 2008 also appears in other agri-environment schemes, which reflects reductions in the Rural Stewardship Scheme.
Revisions to previous TIFF estimates
Revisions have been made to the TIFF series since publication last year. The 2007 TIFF estimate has been revised up by Ł13.9 million (2.2 per cent) and there have also been changes of this magnitude to some of the previous years.
Revisions to 2007 are mostly associated with the receipt of additional data which was unavailable this time last year. Availability of the 2007-08 Farm Accounts Survey data means that previous forecasting of many of the 2007 input costs have been replaced by actual data. The availability of the 2007 December Survey results replace previous assumptions, especially in relation to livestock and machinery numbers.
Revisions to the TIFF series can also result from improvements and refinements to TIFF methodologies and the correction of any previous errors.
For 2007, the largest revisions have been to; Finished Cattle and Calves (down Ł18.7 million), Consumption of Fixed Capital (up Ł17.3 million), Other Agri-Environment Schemes (up Ł15.7 million), Fruit (up Ł14.7 million), Total Non-Agricultural Activities (up Ł11.5 million).
Further information on revisions is available on request.
Additional information and analysis
In order to provide more information on TIFF we have released an additional table showing the detail of the TIFF account for 1999 to 2008.
Further detailed tables showing price and volume components of the TIFF estimates for 2008 and previous years, along with other related analysis and charts will be published in the Spring 2009 report titled 'Scottish Agriculture Output, Input and Income Statistics.'
SECTION B: Farm Level Estimates - Net Farm Income (NFI)
Estimates of Net Farm Income (NFI) come from the Farm Accounts Survey for Scotland, which was based on a sample of 442 farms in 2007-08 and 472 farms in 2006-07. The survey only includes full-time farms above a certain size (over and above 0.5 Standard Labour Requirements) and covers most main farm types in Scotland, excluding horticulture, specialist pig and specialist poultry producers.
NFI represents the return to the farmer and spouse for their manual and managerial labour on tenant-type farming and is intended as a consistent measure of the profitability of tenant-type farming. NFI is not a proxy either for farm business income or for farm household income, and should not be compared directly with the TIFF estimates. In addition it should be noted that the 2007-08 NFI results, which are based on accounting periods, lag the 2008 TIFF results which are based on calendar years. This is most prominent in the crop sector, where NFI results are based on the 2007 harvest, whereas TIFF results take account of the 2008 harvest.
Following the public consultation on farm income measures in 2007, we are developing new estimates of Farm Business Income (FBI), which will better reflect actual incomes of farm businesses than NFI. First estimates of FBI are scheduled for publication later on in 2009.
Estimates of NFI by farm type should be treated with some caution as they are based on relatively small sample sizes. Trends for most farm types are also subject to annual sample variations, as a small number of farms join and leave the survey each year.
Revisions have been made to the 2006-07 NFI estimates published in January 2008. These revisions are due to the inclusion of additional farm accounts in the results, which have been finalised since the previous publication. Revisions are also due to updates in the classification of farm types for farms in the survey.
The table above shows NFI results by farm type between 2006-07 and 2007-08
Overall, NFI increased between 2006-07 and 2007-08, with increases in all farm types other than Lowground Cattle and Sheep. The large increase for Specialist Cereal and General Cropping farms was primarily due to increases in the value of cereal output, reflecting high cereal prices during 2007-08, which more than offset corresponding increases in input costs.
Dairy farms experienced a large increase in NFI, as the value of milk output more than offset corresponding increases in animal feed, labour, livestock expenses and other input costs.
The 2007-08 NFI results incorporate higher grants and subsidies compared to 2006-07. Overall there is a 50 per cent increase in LFASS payments, as 2007-08 includes core LFASS payments, whereas 2006-07 only includes the one-off supplement payment associated with the re-alignment of LFASS payments towards the end of the 2007 calendar year. Also, 2007-08 includes one-off payments made under the Scottish Ewe Scheme. These increases have the greatest impact on LFA farm types.
The increase in NFI for LFA Specialist Sheep farms is primarily due to an increase in grants and subsidies but is also partly due to a decrease in input costs, such as labour. Higher grants and subsidies were the primary cause of increases in NFI for LFA Specialist Beef and LFA Mixed Cattle and Sheep farms. LFA Mixed Cattle and Sheep also increased crop and livestock output.
Lowland Cattle and Sheep farms showed a reduction in NFI. As these results are based on just 12 farms they need to be treated with additional caution, especially as some of the farms in the sample have made changes to their agricultural activities, which may not be representative of all Lowland Cattle and Sheep farms.
The NFI increase for Mixed farms was primarily due to increases in output values of cereals.
More detailed information and analysis from the Farm Accounts Survey will be published in Spring 2009 in the 'Farm Incomes in Scotland' publication.