
Public Sector Finances, UK: December 2020 - Borrowing Hits Highest Since World War Two
22nd January 2021
Public sector net borrowing (excluding public sector banks, PSNB ex) is estimated to have been £34.1 billion in December 2020, £28.2 billion more than in December 2019, which is both the highest December borrowing and the third-highest borrowing in any month since monthly records began in 1993.
Central government tax receipts are estimated to have been £43.6 billion in December 2020 (on a national accounts basis), £1.4 billion less than in December 2019, with notable falls in taxes on production such as Value Added Tax (VAT) and Business Rates.
Central government bodies are estimated to have spent £86.2 billion on day-to-day activities (current expenditure) in December 2020, £26.1 billion more than in December 2019; this growth includes £10.0 billion additional expenditure on coronavirus job support schemes.
Public sector net borrowing (PSNB ex) in the first nine months of this financial year (April to December 2020) is estimated to have been £270.8 billion, £212.7 billion more than in the same period last year and the highest public sector borrowing in any April to December period since records began in 1993.
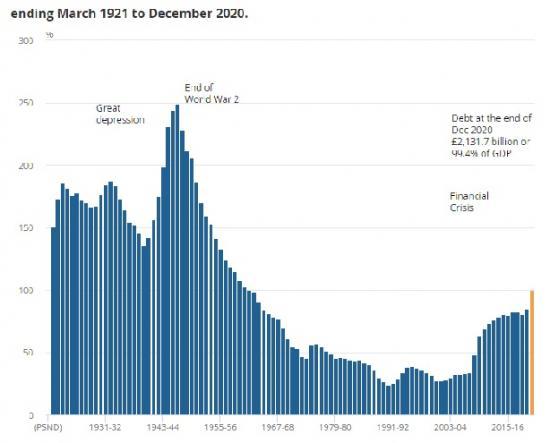
Public sector net debt excluding public sector banks (PSND ex) rose by £333.5 billion in the first nine months of the financial year to reach £2,131.7 billion at the end of December 2020, or around 99.4% of GDP; this was the highest debt to GDP ratio since the financial year ending 1962.
Central government net cash requirement (excluding UK Asset Resolution Ltd and Network Rail) was £33.4 billion in December 2020, bringing the current financial year-to-December total to £318.1 billion, nearly double the highest cash requirement in any other April to December period since records began in 1984.
General government net borrowing in the first nine months of this financial year (April to December 2020) is estimated to have been around 12.7% of GDP, while general government gross debt stood at around 102.9% of GDP at the end of December 2020; statistics for the general government sector are used for international comparisons and include central and local government only.
The impact of the coronavirus on the public finances
The coronavirus (COVID-19) pandemic has had a substantial impact on the economy and subsequently on public sector borrowing and debt.
Central government tax and national insurance receipts (combined) in the nine months-to-December 2020 fell by £39.6 billion (or 7.8%) compared with the same period in 2019, while government support for individuals and businesses during the pandemic contributed to an increase of £169.3 billion (or 30.7%) in central government day-to-day (or current) spending.
The latest official forecasts, published by the Office for Budget Responsibility (OBR) on 25 November 2020, indicate that the £270.8 billion borrowed by the public sector in the financial year-to-December 2020 could reach £393.5 billion by the end of March 2021.
Larger coronavirus (COVID-19) support schemes by implementation status
In total, at least 50 schemes have been announced by the UK government and the devolved administrations to support individuals and businesses during the pandemic. In this section we list the largest of the active schemes by implementation status within the public sector finances.
More details on the impact of the pandemic on the public sector finances are provided in Section 12 of this release and the accompanying Recent and upcoming changes to public sector finances, December 2020 article.
Schemes fully recorded in compliance with existing international statistical guidance are:
COVID-19 Corporate Financing Facility
Coronavirus Job Retention Scheme (CJRS)
Self-employment Income Support Scheme (SEISS)
Eat Out to Help Out
miscellaneous subsidies paid out to businesses
The following schemes are partially or not yet implemented in the public sector finance statistics:
Coronavirus Business Interruption Loan Scheme
Coronavirus Large Business Interruption Loan Scheme
Bounce Back Loan Scheme
Future Fund
Emergency Measures Agreements for train operating companies
Trade Credit Reinsurance Scheme
Finally, some schemes have been announced but relate to future periods. This category includes cases where the scheme may be open for applications, but no payments have yet been made. Schemes that have been postponed and remain inactive are also included in this category:
Job Support Scheme (JSS)
Local Restrictions Support Grant
Lockdown Grants (January 2021)
Borrowing in December 2020
In December 2020, the public sector spent more money than it received in taxes and other income, requiring it to borrow £34.1 billion, £28.2 billion more than it borrowed in December 2019.
The extra funding required to support government coronavirus support schemes combined with reduced cash receipts and a fall in gross domestic product (GDP) have all helped push public sector net debt as a ratio of GDP to levels last seen in the early 1960s. Public sector net debt (excluding public sector banks) at the end of December 2020 was equivalent to 99.4% of GDP.
Central government expenditure
Central government bodies spent £91.7 billion in December 2020, £28.1 billion more than in December 2019. Of this, £86.2 billion was spent on day-to-day activities (often referred to as current expenditure), such as:
providing services and grants (for example, related to education, defence, and health and social care) - including the current job furlough schemes
payment of social benefits (such as pensions, unemployment payments, Child Benefit and Statutory Maternity Pay)
payment of the interest on the government's outstanding debt
The remaining £5.5 billion was spent on capital investment such as infrastructure.
Central government expenditure on goods and services
Central government departments spent £10.2 billion more on goods and services in December 2020 than in December 2019, including £9.3 billion more on procurement and £1.1 billion more on pay. These increases partially reflect the expenditure by the Department of Health and Social Care (DHSC), devolved administrations and other departments in response to the coronavirus pandemic.
Subsidies paid by central government
In December 2020, central government paid £11.9 billion more in subsidies to businesses and households than in December 2019. These additional payments included the cost of the job furlough schemes; £4.7 billion as a part of the Coronavirus Job Retention Scheme (CJRS) and £5.3 billion Self Employment Income Support Scheme (SEISS).
Local government and public corporations
Both local government and public corporations' data for December 2020 are initial estimates, largely based on the Office for Budget Responsibility's (OBR's) Economic and fiscal outlook (November 2020),which will be revised when further information is available.
Subsidies paid out to businesses as part of the Coronavirus Small Business Grant Fund, the Coronavirus Retail, Hospitality and Leisure Grant Fund, the Coronavirus Local Authority Discretionary Grants, and similar schemes in devolved administrations, are included based on administrative data published by the Ministry of Housing, Communities and Local Government (MHCLG) and by the Scottish and Welsh Governments.
Current and capital transfers between these sub-sectors and central government are based on administrative data supplied by HM Treasury and have no impact at the public sector level.
Borrowing in the current financial year-to-date
In the current financial year to December 2020, the public sector borrowed £270.8 billion, £212.7 billion more than in the same period last year.
This substantial increase largely reflects the impact of the pandemic on the public finances, with the furlough schemes alone adding £67.6 billion to borrowing in the financial year-to-December 2020.
Note
The above information is extracts from the report published today by The Office for National Statistics. To read the full report with many links, graphs and tables go HERE
Our Social Media