What Might Rising Interest Rates Mean For Different Generations?
24th October 2021
Earlier last week, markets reacted to comments by the governor of the Bank of England by bringing forward their expectations of when interest rates will rise. Bank Rate currently sits at an ultra-low 0.1% and hasn't exceeded 1% since January 2009 but markets are now pricing-in an increase at next month's MPC meeting and expect rates to reach 1% by next summer.
It remains uncertain when any rate rises will arrive, and they are likely to be gradual when they do. However, questions are being asked about what effects rising rates would have on the economic prospects of different generations. This observation highlights that the rising outlook for interest rates over the last 18 months is modest in the context of the falls seen over the last 15 years and expectations are that interest rates will remain low for years ahead. The key effects of rising rates are likely to be increased mortgage payments for those of working-age in the short-term, and any effects on asset prices relative to incomes are likely to be modest compared to the large increases seen over recent decades.
Impact on interest income and debt repayments
The most obvious and immediate impacts of an increase in interest rates come through its effects on income from interest-bearing accounts and on debt repayments - such as mortgages and credit cards - with variable interest rates. A change in interest rates won't necessarily be passed on immediately or fully into a change in the interest paid on savings accounts and on the rates of interest charged on loans. For example, a growing share of new mortgages taken out in recent years have rates that are fixed for five years or longer. Nevertheless, we get an impression of which age-groups stand to gain or lose from the impacts of a rate rise on interest income and debt payments by looking at the size of their debts (including mortgages, unsecured loans and credit card balances) compared to their interest-bearing assets (including current accounts, savings accounts, cash ISAs and National Savings and Investments products).
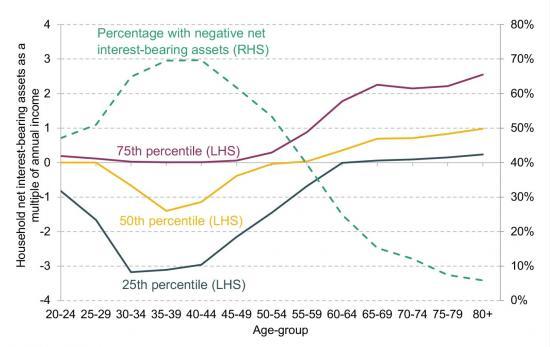
Figure 1.1 shows the percentage of individuals who live in a household with debts (not including student loans where the interest rate is fixed or linked to the RPI) larger than their interest-bearing assets, split by age-group. This share increases from around half of those in their 20s to peak at 70% of those in their late 30s and early 40s, before declining with age. This pattern is driven by people taking out debt - including mortgages when they buy a home - as they move through their 20s and 30s and then paying this down as they age, while accumulation of interest-bearing assets grows with age, particularly for those older than 50.
Figure 1.1 also shows the 25th percentile, 50th percentile and 75th percentile of the distribution of household net interest-bearing assets (i.e. interest-bearing assets minus debts) as a share of annual income. The age-pattern in debt and asset holding means while the median individual in their late 30s or early 40s is in a household with net interest-bearing debt worth more than annual income, the median person in their late 60s and 70s has household net interest bearing assets worth 70% or more of annual income. Differences within age-groups are substantial: while 30% of those in their early 40s have net interest bearing assets, one quarter have net debts - mostly mortgages - worth more than three times annual income.
This means that on average, those in their 30s and 40s stand to lose the most, and those around retirement to gain the most, from the short-term impact of a rise in interest rates on interest income and debt repayments. However, the differences within generations are also large.
Figure 1.1. Distribution of household net interest-bearing assets as a multiple of annual income (LHS) and percentage of individuals in households with negative net interest-bearing assets (RHS), by age-group
Source: Author's calculations using Wealth and Assets Survey Round 6 (2016-2018)
Note: Interest-bearing assets is the sum of current accounts, savings accounts, cash ISAs, National Savings and Investments products, net of mortgages, formal unsecured loans (not including student loans) and outstanding credit card balances.
Earlier last week, markets reacted to comments by the governor of the Bank of England by bringing forward their expectations of when interest rates will rise. Bank Rate currently sits at an ultra-low 0.1% and hasn't exceeded 1% since January 2009 but markets are now pricing-in an increase at next month's MPC meeting and expect rates to reach 1% by next summer.
It remains uncertain when any rate rises will arrive, and they are likely to be gradual when they do. However, questions are being asked about what effects rising rates would have on the economic prospects of different generations. This observation highlights that the rising outlook for interest rates over the last 18 months is modest in the context of the falls seen over the last 15 years and expectations are that interest rates will remain low for years ahead. The key effects of rising rates are likely to be increased mortgage payments for those of working-age in the short-term, and any effects on asset prices relative to incomes are likely to be modest compared to the large increases seen over recent decades.
Impact on interest income and debt repayments
The most obvious and immediate impacts of an increase in interest rates come through its effects on income from interest-bearing accounts and on debt repayments - such as mortgages and credit cards - with variable interest rates. A change in interest rates won't necessarily be passed on immediately or fully into a change in the interest paid on savings accounts and on the rates of interest charged on loans. For example, a growing share of new mortgages taken out in recent years have rates that are fixed for five years or longer. Nevertheless, we get an impression of which age-groups stand to gain or lose from the impacts of a rate rise on interest income and debt payments by looking at the size of their debts (including mortgages, unsecured loans and credit card balances) compared to their interest-bearing assets (including current accounts, savings accounts, cash ISAs and National Savings and Investments products).
Figure 1.1 shows the percentage of individuals who live in a household with debts (not including student loans where the interest rate is fixed or linked to the RPI) larger than their interest-bearing assets, split by age-group. This share increases from around half of those in their 20s to peak at 70% of those in their late 30s and early 40s, before declining with age. This pattern is driven by people taking out debt - including mortgages when they buy a home – as they move through their 20s and 30s and then paying this down as they age, while accumulation of interest-bearing assets grows with age, particularly for those older than 50.
Figure 1.1 also shows the 25th percentile, 50th percentile and 75th percentile of the distribution of household net interest-bearing assets (i.e. interest-bearing assets minus debts) as a share of annual income. The age-pattern in debt and asset holding means while the median individual in their late 30s or early 40s is in a household with net interest-bearing debt worth more than annual income, the median person in their late 60s and 70s has household net interest bearing assets worth 70% or more of annual income. Differences within age-groups are substantial: while 30% of those in their early 40s have net interest bearing assets, one quarter have net debts – mostly mortgages – worth more than three times annual income.
This means that on average, those in their 30s and 40s stand to lose the most, and those around retirement to gain the most, from the short-term impact of a rise in interest rates on interest income and debt repayments. However, the differences within generations are also large.
Figure 1.1. Distribution of household net interest-bearing assets as a multiple of annual income (LHS) and percentage of individuals in households with negative net interest-bearing assets (RHS), by age-group
Source: Author's calculations using Wealth and Assets Survey Round 6 (2016-2018)
Note: Interest-bearing assets is the sum of current accounts, savings accounts, cash ISAs, National Savings and Investments products, net of mortgages, formal unsecured loans (not including student loans) and outstanding credit card balances.
Impact on asset prices
What about the wider impacts of an increase in interest rates on asset prices? Research by the Bank of England found that falling rates following the financial crisis increased asset prices and that this had the most positive effect on wealth for those around retirement age, who hold the largest amounts of financial assets, housing wealth and un-annuitised pension wealth. A rise in asset prices, if maintained, implies a gain for those who hold those assets and sell them in the future and a loss for those who would buy them.
Does this mean that a rise in rates will decrease the value of financial assets and housing wealth, hitting the wealth of those around retirement age the most? Would a fall in asset prices be something to welcome for those at younger ages who aspire to get onto or move up the housing ladder?
The prices of assets like houses and stocks and shares depend not just on interest rates today but the outlook for rates over the medium term. Figure 1.2 shows that there has been a significant increase in the future interest rates implied by government bond yields since April 2020, when the pandemic began, especially at shorter time horizons. However, these increases are actually modest compared to the enormous decline in rates that has taken place since 2006.
This article if from the institute for Fiscal Studies
Read it with more links to information and date HERE