Inflation And The Cost Of Living For UK Households, Overview: June 2022
22nd June 2022
From the Office for National statistics published today 22 June 2022.
Inflation and cost of living article collating and updating analysis of different price measures.
1.Main points
Household Cost Indices (HCIs) saw similar inflation rates as the Consumer Prices Index (CPI) and the Consumer Prices Index including owner occupiers' housing costs (CPIH) at the end of 2021, reflecting common drivers of inflation.
All three measures of consumer price inflation have seen sharp rises since March 2021.
Transport has contributed more to rising inflation for higher income households than lower income households over recent months. This resulted in Households in the ninth income decile seeing higher inflation rates than those in the second income decile at the end of 2021, as measured by the HCIs.
Current drivers of inflation include essentials such as food and non-alcoholic beverages, transport and housing, water, electricity, gas and other fuels; which combined account for over 50% of the CPIH basket by weight.
Experimental data found that a group of 30 lowest-cost grocery items had a similar 12-month growth rate as the food and non-alcoholic beverages component of CPIH in the year to April 2022, but there was wide variation between products.
Around 60% of adults report spending less on non-essential items in response to rising costs.
Drivers of inflation
Price movements for the lowest cost products
Individual experiences of inflation
Related links
Print this article
Download as PDF
1.Main points
Household Cost Indices (HCIs) saw similar inflation rates as the Consumer Prices Index (CPI) and the Consumer Prices Index including owner occupiers' housing costs (CPIH) at the end of 2021, reflecting common drivers of inflation.
All three measures of consumer price inflation have seen sharp rises since March 2021.
Transport has contributed more to rising inflation for higher income households than lower income households over recent months. This resulted in Households in the ninth income decile seeing higher inflation rates than those in the second income decile at the end of 2021, as measured by the HCIs.
Current drivers of inflation include essentials such as food and non-alcoholic beverages, transport and housing, water, electricity, gas and other fuels; which combined account for over 50% of the CPIH basket by weight.
Experimental data found that a group of 30 lowest-cost grocery items had a similar 12-month growth rate as the food and non-alcoholic beverages component of CPIH in the year to April 2022, but there was wide variation between products.
Around 60% of adults report spending less on non-essential items in response to rising costs.
CPIH is our preferred measure of consumer price inflation as it includes a measure of owner occupiers' housing costs, making it more comprehensive than the CPI. In recent months the 12-month growth rate of CPIH has been lower than the 12-month growth rate of CPI, as owner occupiers' housing costs have seen lower price increases than other parts of the basket, which are common between the two measures.
Both CPI and CPIH provide aggregate measures of movements in the price level in the UK, based on total expenditure within the economy. An alternative set of measures, the Household Cost Indices (HCIs) focuses more directly on particular households' experiences of inflation.
One of the important differences in these measures is the approach to housing costs, as explained in our Household Costs Indices methodology article. CPIH focuses on the consumption of housing as a service and uses rental equivalence to estimate a value for the housing services consumed by owner occupiers. HCIs take a more direct, payments-based approach, and include mortgage payments as part of monthly expenditure for owner occupiers.
Between April and December 2021 (the period covered by the most recently available HCIs), the 12-month growth rates of HCIs, CPI and CPIH were all broadly similar. Prior to this, HCIs saw considerably lower inflation rates than CPI or CPIH between July 2020 and March 2021. This difference reflected trends in housing costs at the time, specifically the role of stamp duty (as explained in our latest Household Costs Indices bulletin) which is included in HCIs but not in CPI or CPIH.
Since April 2021, inflation has been broad based but driven mainly by energy and motor fuels, which have similar effects on the 12-month growth rates of CPI, CPIH and HCIs. These similarities outweigh the differences from housing costs in the different measures, resulting in similar inflation rates.
3.Inflation for different household types
Both the Consumer Prices Index including owner occupiers' housing costs (CPIH) and Household Cost Indices (HCIs) can be calculated for different subgroups to derive inflation rates for different household types, based on their spending patterns.
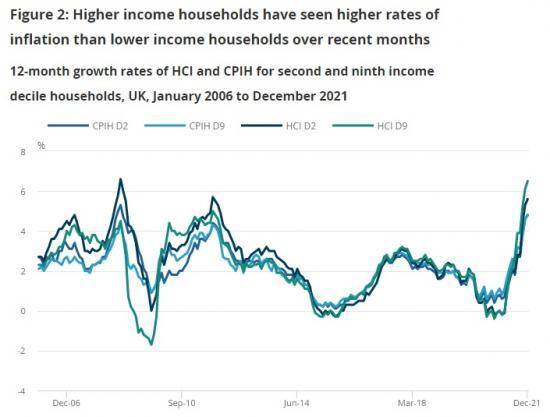
Figure 2 shows 12-month growth rates of consumer prices for the second and ninth income deciles of households, for both CPIH and HCIs, from January 2006 to December 2021. We avoid using the first (lowest income) and tenth (highest income) deciles as these are often volatile and can include, for example, households with low income but high wealth, which distorts the picture. Using the second and ninth deciles instead provides a more realistic picture of the experience of households at the lower and higher end of the income scale, respectively.
There has been considerable volatility over the period, and at times, large variation in the experience of those on the lower and higher end of the income scale. This was most notable during the 2008 to 2009 financial crisis when households with higher incomes saw negative growth in the HCI measure for several months.
More recently, inflation for higher and lower income households has been rising in both the CPIH and HCI measures, although to a different extent between higher and lower income households in the HCI measure. This shows households in the ninth income decile seeing an HCI 12-month growth rate of 6.5% in December 2021, compared with a rate of 5.6% for those in the second income decile.
The CPIH consistent inflation rate for the second and ninth income deciles was equal for the three months between October and December 2021, as varying contributions from the different components offset one another, leading to the same aggregate 12-month growth rate.
The higher HCI inflation rate for higher income households reflects current drivers of inflation and the different expenditure patterns of these households. Higher income households see a considerably higher contribution from transport. This may reflect the types of transport used by those with different income levels. Higher income households typically use cars more than public transport and are more likely to experience the high price increases seen for motor fuels over the last year.
Higher income households also have higher contributions from restaurants and hotels, and recreation and culture, likely because they have more disposable income to spend on eating out and recreational activities.
The main drivers of consumer price inflation over recent months have been energy, transport and food. These make up a large part of essential spending for most households and have a relatively low price elasticity of demand as there is a limit to how much consumers can reduce their consumption of food, energy and transport, even as prices rise. As such, when prices for these essentials increase, consumers may be forced to reduce spending elsewhere to maintain at least a minimum level of consumption of the essentials. This is likely to have a disproportionate effect on lower income households as they have less disposable income that can be switched from non-essential spending to cover necessities.
These estimates of inflation by income decile use data from the Living Costs and Food Survey (LCF) to weight the expenditure of different households and derive inflation rates accordingly. The Household Costs Indices use LCF data at a two-year lag, so 2019 is the most recently used period, and therefore reflect expenditure patterns in 2019, rather than the experience of households during the recent period of unusually high inflation.
4.Drivers of inflation
Three of the biggest drivers of consumer price inflation over recent months have been "housing, water, electricity, gas and other fuels", "transport" and "food and non-alcoholic beverages". These three components collectively account for over 50% of the Consumer Prices Index including owner occupiers' housing costs (CPIH) basket by weight and contain many essential items for which a certain amount of consumption is required.
Price growth for "housing, water, electricity, gas and other fuels" has largely been driven by energy since the Ofgem price cap rose in April 2022. Prices for electricity, gas and other fuels rose by over 46% in one month between March and April 2022 and rose slightly again in May 2022.
Transport has also been a big driver of consumer price inflation over recent months, with motor fuels putting particular upward pressure on the annual growth rate. In May 2022, 12-month growth rates for petrol and diesel reached 32.8%, the highest the rate has been since the constructed consumer price inflation series began in January 1989.
The three main factors cited for a rise in the cost of living were food, energy and fuel, which aligns with the trends seen in inflation over recent months. The difference in price movements between motor fuels and public transport may also help explain why higher income households have seen larger contributions to inflation from transport than lower income households have. Higher income households are more likely to drive and use motor fuels, which have seen annual price growth of 32.8% in May 2022. Lower income households are more likely to use public transport, where for example, bus fares have seen annual price growth of 0.2% in May 2022.
Read the full report HERE