Recent Trends In UK Food And Drink Producer And Consumer Prices: January 2023
9th March 2023
UK food and drink inflation trends, using data from producer price inflation, consumer price inflation and the Business Insights and Conditions Survey (BICS).
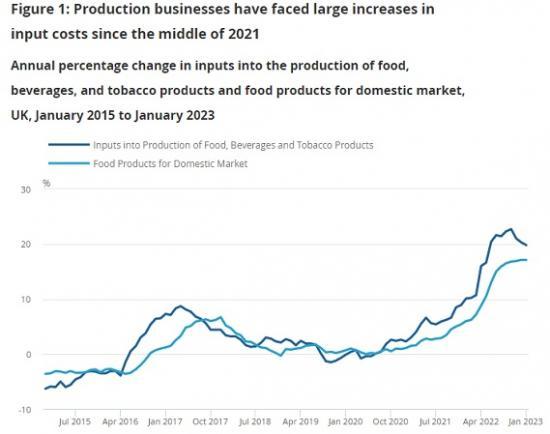
In the 12 months to January 2023, the price of inputs into the production of food, drinks (both alcoholic and non-alcoholic), and tobacco increased by 19.8%.
Imported food material input prices rose by 25.7% in the year to January 2023, compared with 18.0% for domestic food material inputs over the same period.
In the 12 months to January 2023, output food product producer prices increased at their joint-highest annual rate since records began in January 1997 at 17.1%.
Around two-thirds (65.1%) of food and drink retail businesses (excluding microbusinesses) reported the prices of goods and services bought increased in January 2023 compared with December 2022; a similar proportion of food and drink retail businesses (excluding microbusinesses) reported their prices sold increased (63.7%) over the same period.
This "pass through" of higher costs to prices is reflected in the Consumer Price Index including owner occupiers' housing costs, with food and non-alcoholic drink inflation at 16.8% in January 2023.
Overview
UK food prices are rising at the fastest rate in over 40 years. Annual food and non-alcoholic drink Consumer Price Inflation including owner occupiers housing costs (CPIH) was 16.8% in January 2023, down slightly from December 2022 (16.9%). The indicative modelled estimates shown in our Consumer price inflation, historical estimates and recent trends article suggest that the rate would have last been higher in September 1977, when it was estimated to be 17.6%.
While rising food and drink prices will affect most households in the UK, they are more likely to disproportionately affect those on low incomes, as they spend a higher proportion of their household budget on food and drink, as explained in our Inflation and cost of living for household groups, UK article. Higher food and drink prices may lead to some households substituting with cheaper products, reducing consumption of other goods and services or cutting back on food and drink altogether, as explained in our article on the rising cost of everyday foods.
Higher food and drink prices are not unique to the UK with annual OECD food consumer inflation, standing at 15.2% in January 2023, as reported on the OECD website. Global commodity price increases, reflecting higher energy prices, supply chain disruption, and the Russian invasion of Ukraine, have contributed to higher input costs for food and drink businesses. A rise in input costs would be expected to be passed on, to some extent, to the prices firms charge for their outputs of food and drink products, and - for those that are consumer-facing such as retailers - into measures of consumer prices.
Input and output prices for food and drink manufacturers
Input Producer Price Index (PPI) data reflect the price that UK manufacturers pay for the materials and fuels used to produce their products. These price indices include items such as the flour to make bread, the electricity to power a food processing site, and inputs such as plastics and metals in packaging. Short-term changes in producer prices can be volatile because of large price movements in global commodity markets, and at times exchange rate movements.
More information on input and output PPIs can be found in our Producer price indices QMI (Quality and Methodology Information).
After falling modestly in the first half of 2020, businesses have faced large increases in input costs since December 2020. Input prices for all manufacturers increased by 14.1% in the year to January 2023 and the annual rate of input PPI has been positive for the past 26 consecutive months, although in recent months the headline rate has slowed. These increases are historically high, with average annual input PPI in 2022 the highest since records began in 1985.
Food and drink manufacturers have been exposed to these input price pressures. In the year to January 2023, the inputs into the production of food, drinks (both alcoholic and non-alcoholic), and tobacco increased by 19.8%. These annual increases have been in double digits since January 2022, peaking in October 2022 at 22.7% and then slowing until January 2023.
Input PPI serves as an indicator for the inflationary pressures facing manufacturers in relation to the price of materials and fuels used within the production process. This provides some warning of price increases that could feed through into the prices producers charge (output PPI) for their products.
Food product output PPI moves closely with, but is less variable than input PPI, reflecting that firms may not be able to pass on all their input costs into prices charged directly, and try to avoid making frequent price changes. The greater volatility in input PPI may reflect high-frequency movements in commodity and foreign exchange markets. These costs are more likely to be directly reflected in input prices relative to producer output prices and retailer prices. Food producers and retailers face a broader cost base such as supplier margins, wages, and rents, meaning single factors have a lesser effect and there is more scope for offsetting contributions of costs.
In the year to January 2023, output food producer prices continued to increase at their highest annual rate on record at 17.1%.
Annual input price growth has slowed during November 2022 to January 2023; however, these falls are yet to be reflected in annual food product output producer price growth. This is potentially because of the lag effect of input prices feeding into output PPI with food producers unable to pass on costs to wholesalers and retailers because of fixed price contracts. This was evident during the period from 2016 to 2017 when input prices peaked during April 2017, but food product output PPI continued to grow until the peak in December 2017.
Our Business Insights and Conditions Survey (BICS) found that 56.2% of food and drink manufacturers (excluding microbusinesses) reported an increase in the price of goods and services bought in January 2023, down from 79.4% in March 2022. Some of that increase was passed through to customers, with around one-third (27.8%) of food and drink manufacturers reporting increases in factory gate (prices sold) in January 2023 compared with December 2022.
Global commodity prices and supply chain disruption
Both changes in global commodity prices and the impact of bottlenecks on tradeable goods are important determinants in the evolution of food and drink input prices.
Global energy prices have increased substantially since the conflict in Ukraine, particularly for natural gas and oil. Data from the Department for Energy Security and Net Zero (DESNZ) show the price of energy inputs for the manufacturing industry have almost doubled between Quarter 3 (July to Sept) 2021 and Quarter 3 2022. Natural gas accounted for around 60% of the total energy needs for the food and drink manufacturing industry in 2020, as shown in the UK food security report. While vulnerable to price rises, eligible businesses have benefited from the Energy Bill Relief Scheme, as explained in this guidance on GOV.UK.
The conflict in Ukraine contributed to a strong increase in global cereal and vegetable oil prices in 2022, although much of this rise has now dissipated as supply from other countries increased (Figure 2). Fertiliser production was also heavily affected by the conflict, with Russia, Ukraine, and Belarus responsible for a high proportion of fertiliser supply. Higher energy costs have had a compounding effect on fertiliser prices, which has seen imported ammonium nitrate prices increase by around 5% on the year to January 2023, as shown on the Agriculture and Horticulture Development Board website.
The rising cost of energy has increased transportation costs for food and drink across various modes of transport. Higher diesel costs alongside increased global demand following the end of coronavirus (COVID-19) lockdown increased the cost of container shipping during 2021 and into early 2022. According to data from the Department for Energy Security and Net Zero (DESNZ), weekly road diesel prices in the UK reached their highest annual growth since comparable records began at 65.1% in July 2022. Diesel prices have since fallen, although remain 15.2% higher on the year to 27 February 2023.
These further developments add to a broad-based rise in commodity prices that began in 2021, with a rebound in demand for commodities as coronavirus (COVID-19) restrictions eased, while production increased more slowly causing global supply chain pressures.
On average 34.3% of businesses (excluding microbusinesses) in the manufacture of food and drinks products reported experiencing global supply chain disruption between March 2022 and January 2023. This is around twice as much the proportion across all businesses (18.8%).
Of those businesses who reported being unable to get materials, goods and services in the UK or had to make changes to supply chains, around two-thirds (66.2%) of food and drink manufacturers (excluding microbusiness) reported domestic supply chain issues were causing moderate to major disruption to their business in late 2022. This measure is relatively unchanged since June 2022.
Imported and domestic input prices
The patterns in food and drink input producer price inflation may reflect broader market conditions for specific food and drink inputs, but also their level of import exposure, including exchange rate changes and bottlenecks in global supply chains.
Prices for imported inputs into UK food production have been rising faster than domestic inputs since February 2022, coinciding with Russia's invasion of Ukraine. Imported food material input prices rose by 25.7% in the year to January 2023, compared with 18.0% for domestic food material inputs over the same period. Input prices of imported food products peaked in October 2022 at 31.5%, the highest annual rate since records began in 1997. During this month, the gap between imported and domestic inputs was at its widest since June 2009 at 10.6 percentage points.
Given domestic food and drink product inputs account for a higher proportion of the total inputs used in production, they make a greater contribution to annual input producer price inflation (Figure 4). The contribution from imported products has increased since early 2022 to around one-fifth of the contribution to annual food material input Producer Price Index (PPI) in January 2023.
Food and drink business responses to price increase
The extent to which firms can pass on their higher input costs is likely to depend on several factors, such as profit margins, the degree of competition and the scale of price increases. The same is true for the extent to which retailers pass on costs to households.
Figure 5 shows the main responses from businesses within the food and drink supply chain (excluding microbusiness) to price rises during February 2023. Businesses were able to select more than one response option to this question. The most common response from food and drink manufacturers was to absorb costs, the second most common response was to pass costs onto customers. Around 8 in 10 (82.2%) food and drink manufacturers reported absorbing some of the increased costs and 69.3% passed the increased costs on to their customers. This suggests both margins being squeezed for businesses and increases in prices paid by consumers.
All businesses (excluding microbusiness) were less likely to report price increases (12.9%) than the food and drink industry, this results in a lower proportion of all businesses (excluding microbusiness) reporting the use of strategies such as passing costs on to customers and absorbing price increases.
Price increases are asymmetric across the food and drink supply chain with manufacturers, wholesalers, and retailers (excluding microbusiness) more likely to report passing prices on than service providers (for example, restaurants and cafes).
Asymmetries within food and drink industry are apparent when we look at responses to BICS questions on the prices of goods and services bought and sold by businesses each month compared with the previous calendar month. These questions differ slightly to the question which asks businesses how they have been affected by price rises. Businesses were asked for their experience of how they have been affected by price increases for the reference period (6 to 19 February 2023), however, businesses may respond from the point of completion of the questionnaire. This renders the results for these questions not strictly comparable.
Excluding microbusinesses, in January 2023 just over half of businesses in the food and drink manufacturing industry (56.2%) reported an increase in the price of goods or services bought compared with December 2022. Around two-thirds (65.1%) of food and drink retailers reported prices bought increased on the month over the same period. This was higher than all businesses (excluding microbusinesses) with just under half (45.2%) reporting prices bought increased. These proportions are all down from when this question was asked in March 2022.
When asked about the prices of goods or services sold by their businesses (excluding microbusinesses) relative to the previous calendar month, a similar proportion of food and drink retailers reported their prices sold increased (63.7%) compared with prices bought increased (65.1%) in January 2023. However, only around one-third (27.8%) of food and drink manufacturing businesses reported increasing the price of the goods and services sold by their business. The same is true for food and drink service providers, with a lower proportion of businesses reporting an increase in prices sold (29.2%) relative to prices bought (69.4%) compared with December 2022.
The impact on food and drink consumer prices
Excluding microbusinesses, around half of food and drink wholesalers (49.6%) and two-thirds of retailers (63.7%) increased their prices during January 2023 compared with December 2022. This is reflected in the Consumer Price Index including owner occupiers' housing costs (CPIH), with food and non-alcoholic drink inflation at 16.8% in January 2023. Although food and drink wholesale and retail business (excluding microbusiness) responses from the Business Impacts and Conditions Survey (BICS) show that most businesses absorb some increased costs, this is reflected in output producer price growth outstripping consumer price inflation growth in the period up to January 2023.
While output producer prices are an important determinant of food and drink consumer prices, they are not the only contributor. Retailers' costs such as wages, rents and distribution influence the trends we see in consumer price inflation.
Figure 6 plots selected annual rates of food and drink output PPIs against annual food and drink Consumer Price Inflation including owner occupiers housing costs (CPIH) for January 2023. The results show there is a positive association between food and drink output producer prices and consumer prices.
In January 2023, the largest annual increases in food and non-alcoholic drink CPIH at the group level were in milk, cheese and eggs at 31.1%. The increase in the cost of dairy products is driven by higher milk farmgate prices. These data from the Agriculture and Horticulture Development Board (AHDB) show the average farmgate price of milk was 49% higher on the year to December 2022, with large increases throughout 2022. These higher producer prices are reflected in the prices that consumers are paying for dairy products from retailers.
The annual CPIH inflation rate of fruit was the lowest among the eleven CPIH food and non-alcoholic drink groups at 6.0% in January 2023. This corresponds with lower-than-average output producer prices for other processed and preserved fruit and vegetables at 8.2% during the same period. These data may not currently reflect recent trends in fruit and vegetable supply with some media reports of shortages.
Increased food and drink production costs also affect food and drink service providers, including restaurants, bars and cafes. In the year to December 2022 consumer inflation in catering services reached 10.1%, the highest rate in 30 years. This slowed to 9.3% annual growth in January 2023 but remains elevated relative to previous years.
Read the full ONS report HERE