Consumer Price Inflation Up To 10.4% Uk: February 2023
22nd March 2023
The Consumer Prices Index including owner occupiers' housing costs (CPIH) rose by 9.2% in the 12 months to February 2023, up from 8.8% in January.
The largest upward contributions to the annual CPIH inflation rate in February 2023 came from housing and household services (principally from electricity, gas, and other fuels), and food and non-alcoholic beverages.
On a monthly basis, CPIH rose by 1.0% in February 2023, compared with a rise of 0.7% in February 2022.
The Consumer Prices Index (CPI) rose by 10.4% in the 12 months to February 2023, up from 10.1% in January.
On a monthly basis, CPI rose by 1.1% in February 2023, compared with a rise of 0.8% in February 2022.
The largest upward contributions to the monthly change in both the CPIH and CPI rates came from restaurants and cafes, food, and clothing, partially offset by downward contributions from recreational and cultural goods and services (particularly recording media), and motor fuels.
The estimates for February 2023 have been constructed using updated expenditure weights; this is the second and final weights update for 2023.
This release is the first publication to include expanded data on rail fares as part of our project to transform consumer price statistics.
The Consumer Prices Index including owner occupiers' housing costs (CPIH) rose by 9.2% in the 12 months to February 2023, up from 8.8% in January but below a recent peak of 9.6% in October 2022. Indicative modelled consumer price inflation estimates suggest that the October 2022 rate was the highest rate in over 40 years (the CPIH National Statistic series begins in January 2006). Since October 2022, the CPIH annual rate has fluctuated around 9.2%, a rate that was previously recorded just over 30 years ago, between September and December 1990. The rise in the annual rate between January and February 2023 came as a result of prices rising by 1.0% on the month compared with a rise of 0.7% a year earlier.
The Consumer Prices Index (CPI) rose by 10.4% in the 12 months to February 2023, up from 10.1% in January but below a recent peak of 11.1% in October 2022.
Our indicative modelled estimates of consumer price inflation suggest that the October 2022 peak was the highest annual inflation rate since 1981 (the CPI National Statistic series begins in January 1997). The rise in the CPI annual rate between January and February 2023 came as a result of prices rising by 1.1% on the month, compared with a rise of 0.8% a year earlier.
The main drivers of the annual inflation rate for CPIH and CPI are the same where they are common to both measures. However, the owner occupiers' housing costs (OOH) component accounts for 16% of the CPIH and is the main driver for differences between the CPIH and CPI inflation rates. This makes CPIH our most comprehensive measure of inflation, and it is covered in more detail in Section 4: Latest movements in CPIH inflation in this bulletin, while Section 5: Latest movements in CPI inflation provides commentary on the CPI. Section 3: Notable movements in prices covers both CPIH and CPI, though the figures reflect CPIH.
Notable movements in prices
The increase in the annual inflation rate in February 2023 mainly reflected price rises in the restaurants and hotels, food and non-alcoholic beverages, and clothing and footwear divisions. These were partially offset by downward effects coming from recreation and culture, and from motor fuels within the transport division.
Restaurants and hotels
The annual inflation rate for restaurants and hotels was 12.1% in February 2023, up from 10.8% in January, and the highest rate since the constructed historical estimate of 12.1% in July 1991. The rate was last higher, at 12.2%, in June 1991.
he main driver behind the increase in the rate between January and February 2023 came from restaurants and cafes, where prices rose by 11.4% in the year to February 2023, up from 9.4% in the year to January 2023. This was a result of larger price rises between January and February 2023 than between the same two months in 2022. The upward pressure came from price increases for alcohol served in restaurants, cafes and pubs. The rise follows some price falls in January 2023 for items such as gin, whisky and some beers. However, the monthly rise into February 2023 was larger than the fall in January 2023.
Food and non-alcoholic beverages
Food and non-alcoholic beverage prices rose by 18.2% in the year to February 2023, up from 16.8% in January. The annual rate for this category in February 2023 is the highest observed for over 45 years. Indicative modelled estimates suggest that the rate would have last been higher in August 1977, when it was estimated to be 21.9%.
Table of contents
Main points
Consumer price inflation rates
Notable movements in prices
Latest movements in CPIH inflation
Latest movements in CPI inflation
Consumer price inflation data
Glossary
Measuring the data
Strengths and limitations
Related links
Cite this statistical bulletin
Print this statistical bulletin
Download as PDF
1.Main points
The Consumer Prices Index including owner occupiers' housing costs (CPIH) rose by 9.2% in the 12 months to February 2023, up from 8.8% in January.
The largest upward contributions to the annual CPIH inflation rate in February 2023 came from housing and household services (principally from electricity, gas, and other fuels), and food and non-alcoholic beverages.
On a monthly basis, CPIH rose by 1.0% in February 2023, compared with a rise of 0.7% in February 2022.
The Consumer Prices Index (CPI) rose by 10.4% in the 12 months to February 2023, up from 10.1% in January.
On a monthly basis, CPI rose by 1.1% in February 2023, compared with a rise of 0.8% in February 2022.
The largest upward contributions to the monthly change in both the CPIH and CPI rates came from restaurants and cafes, food, and clothing, partially offset by downward contributions from recreational and cultural goods and services (particularly recording media), and motor fuels.
The estimates for February 2023 have been constructed using updated expenditure weights; this is the second and final weights update for 2023.
This release is the first publication to include expanded data on rail fares as part of our project to transform consumer price statistics.
Back to table of contents
2.Consumer price inflation rates
Table 1: CPIH, OOH component and CPI index values, and annual and monthly rates
UK, February 2022 to February 2023
CPIH
Index
(UK,
2015 =
100) CPIH
12-
month
rate CPIH 1-
month
rate CPI Index
(UK,
2015=100) CPI 12-
month
rate CPI 1-
month
rate OOH
Index
(UK,
2015=100) OOH
12-
month
rate
2022 Feb 115.4 5.5 0.7 115.8 6.2 0.8 111.8 2.5
Mar 116.5 6.2 0.9 117.1 7.0 1.1 112.1 2.7
Apr 119.0 7.8 2.1 120.0 9.0 2.5 112.4 2.9
May 119.7 7.9 0.6 120.8 9.1 0.7 112.8 3.0
Jun 120.5 8.2 0.7 121.8 9.4 0.8 113.1 3.2
Jul 121.2 8.8 0.6 122.5 10.1 0.6 113.5 3.4
Aug 121.8 8.6 0.5 123.1 9.9 0.5 113.8 3.5
Sep 122.3 8.8 0.4 123.8 10.1 0.5 114.2 3.5
Oct 124.3 9.6 1.6 126.2 11.1 2.0 114.5 3.6
Nov 124.8 9.3 0.4 126.7 10.7 0.4 115.0 3.7
Dec 125.3 9.2 0.4 127.2 10.5 0.4 115.5 3.8
2023 Jan 124.8 8.8 -0.4 126.4 10.1 -0.6 115.9 3.8
Feb 126.0 9.2 1.0 127.9 10.4 1.1 116.2 3.9
Source: Consumer price inflation from the Office for National Statistics
Download this tableTable 1: CPIH, OOH component and CPI index values, and annual and monthly rates
.xls .csv
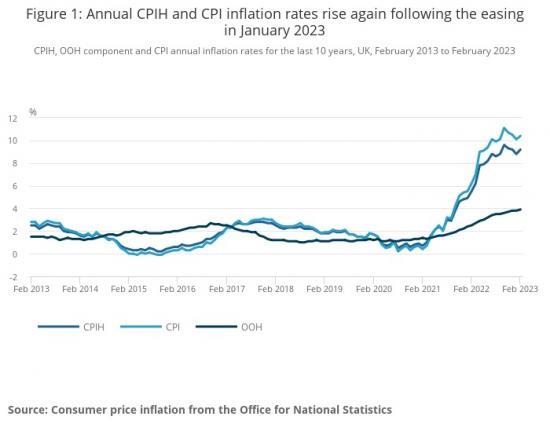
Figure 1: Annual CPIH and CPI inflation rates rise again following the easing in January 2023
CPIH, OOH component and CPI annual inflation rates for the last 10 years, UK, February 2013 to February 2023
CPIHCPIOOHFeb 2023Feb 2022Feb 2021Feb 2020Feb 2019Feb 2018Feb 2017Feb 2016Feb 2015Feb 2014Feb 2013-2024681012%
Jun 2016
● CPIH: 0.8
● CPI: 0.5
● OOH: 2.3
Source: Consumer price inflation from the Office for National Statistics
Download this chartFigure 1: Annual CPIH and CPI inflation rates rise again following the easing in January 2023
Image .csv .xls
The Consumer Prices Index including owner occupiers' housing costs (CPIH) rose by 9.2% in the 12 months to February 2023, up from 8.8% in January but below a recent peak of 9.6% in October 2022. Indicative modelled consumer price inflation estimates suggest that the October 2022 rate was the highest rate in over 40 years (the CPIH National Statistic series begins in January 2006). Since October 2022, the CPIH annual rate has fluctuated around 9.2%, a rate that was previously recorded just over 30 years ago, between September and December 1990. The rise in the annual rate between January and February 2023 came as a result of prices rising by 1.0% on the month compared with a rise of 0.7% a year earlier.
The Consumer Prices Index (CPI) rose by 10.4% in the 12 months to February 2023, up from 10.1% in January but below a recent peak of 11.1% in October 2022. Our indicative modelled estimates of consumer price inflation suggest that the October 2022 peak was the highest annual inflation rate since 1981 (the CPI National Statistic series begins in January 1997). The rise in the CPI annual rate between January and February 2023 came as a result of prices rising by 1.1% on the month, compared with a rise of 0.8% a year earlier.
The main drivers of the annual inflation rate for CPIH and CPI are the same where they are common to both measures. However, the owner occupiers' housing costs (OOH) component accounts for 16% of the CPIH and is the main driver for differences between the CPIH and CPI inflation rates. This makes CPIH our most comprehensive measure of inflation, and it is covered in more detail in Section 4: Latest movements in CPIH inflation in this bulletin, while Section 5: Latest movements in CPI inflation provides commentary on the CPI. Section 3: Notable movements in prices covers both CPIH and CPI, though the figures reflect CPIH.
Back to table of contents
3.Notable movements in prices
The increase in the annual inflation rate in February 2023 mainly reflected price rises in the restaurants and hotels, food and non-alcoholic beverages, and clothing and footwear divisions. These were partially offset by downward effects coming from recreation and culture, and from motor fuels within the transport division.
Table 2: CPIH annual and monthly inflation rates by division
UK, February 2022, January 2023, and February 2023
CPIH 12-month rate CPIH 1-month rate
January 2023 February 2023 February 2022 February 2023
CPIH All items 8.8 9.2 0.7 1.0
Food and non-
alcoholic
beverages 16.8 18.2 0.9 2.1
Alcohol and
tobacco 5.2 5.7 0.1 0.6
Clothing and
footwear 6.2 8.0 0.8 2.5
Housing and
household
services 11.8 11.8 0.2 0.2
of which owner
occupiers'
housing costs 3.8 3.9 0.2 0.3
Furniture and
household goods 9.1 8.6 2.2 1.7
Health 6.4 6.9 0.0 0.6
Transport 3.4 3.1 0.9 0.7
Communication 2.3 3.6 0.1 1.3
Recreation and
culture 5.0 4.1 1.7 0.8
Education 3.2 3.2 0.0 0.0
Restaurants and
hotels 10.8 12.1 0.7 2.0
Miscellaneous
goods and
services 5.9 6.7 0.1 0.8
All goods 13.3 13.4 1.1 1.3
All services 5.2 5.6 0.3 0.8
CPIH exc food,
energy, alcohol
and tobacco (core
CPIH) 5.3 5.7 0.7 1.0
Source: Consumer price inflation from the Office for National Statistics
Download this tableTable 2: CPIH annual and monthly inflation rates by division
.xls .csv
Restaurants and hotels
The annual inflation rate for restaurants and hotels was 12.1% in February 2023, up from 10.8% in January, and the highest rate since the constructed historical estimate of 12.1% in July 1991. The rate was last higher, at 12.2%, in June 1991.
Figure 2: Annual inflation rate for restaurants and hotels last higher in June 1991
CPIH, and restaurants and hotels annual inflation rates, UK, February 2013 to February 2023
CPIHRestaurants and hotelsFeb 2013Feb 2014Feb 2015Feb 2016Feb 2017Feb 2018Feb 2019Feb 2020Feb 2021Feb 2022Feb 2023-4-202468101214%
Nov 2017
● CPIH: 2.8
● Restaurants and hotels: 3.2
Source: Consumer price inflation from the Office for National Statistics
Download this chartFigure 2: Annual inflation rate for restaurants and hotels last higher in June 1991
Image .csv .xls
The main driver behind the increase in the rate between January and February 2023 came from restaurants and cafes, where prices rose by 11.4% in the year to February 2023, up from 9.4% in the year to January 2023. This was a result of larger price rises between January and February 2023 than between the same two months in 2022. The upward pressure came from price increases for alcohol served in restaurants, cafes and pubs. The rise follows some price falls in January 2023 for items such as gin, whisky and some beers. However, the monthly rise into February 2023 was larger than the fall in January 2023.
Food and non-alcoholic beverages
Food and non-alcoholic beverage prices rose by 18.2% in the year to February 2023, up from 16.8% in January. The annual rate for this category in February 2023 is the highest observed for over 45 years. Indicative modelled estimates suggest that the rate would have last been higher in August 1977, when it was estimated to be 21.9%.
Figure 3: Annual inflation rate for food and non-alcoholic beverages highest for over 45 years
CPIH, and food and non-alcoholic beverages annual inflation rates, UK, February 2013 to February 2023
CPIHFood and non-alcoholic beveragesFeb 2013Feb 2014Feb 2015Feb 2016Feb 2017Feb 2018Feb 2019Feb 2020Feb 2021Feb 2022Feb 2023-505101520%
Jun 2020
● CPIH: 0.8
● Food and non-alcoholic beverages: 1.2
Source: Consumer price inflation from the Office for National Statistics
Download this chartFigure 3: Annual inflation rate for food and non-alcoholic beverages highest for over 45 years
Image .csv .xls
The increase in the annual rate for food and non-alcoholic beverages between January and February 2023 was driven by price movements from 8 of the 11 detailed classes, with no significant offsetting downward pushes. The largest upward effect came from vegetables, where prices rose in the month to February 2023 by more than a year earlier. There have been media reports of shortages of salad produce and other vegetables, reportedly because of bad weather in southern Europe and Africa, and the impact of higher electricity prices on produce grown out of season in greenhouses in the UK and northern Europe. These price movements resulted in an annual rate of 18.0% for vegetables in the year to February 2023, the highest rate since February 2009. The annual rates in February 2023 for bread and cereals, chocolate and confectionery, other food products (principally ready-meals and sauces) and hot beverages were each the highest since at least 2008.
Clothing and footwear
Prices of clothing and footwear rose, overall, by 8.0% in the year to February 2023, up from 6.2% in the year to January 2023, but below the recent high of 8.5% in October 2022. On a monthly basis, prices rose by 2.5% between January and February 2023, compared with a smaller rise of 0.8% between the same two months a year ago. Prices usually rise between January and February as new stock starts to enter the shops following the new year sales period. However, the 2.5% rise in 2023 is the largest observed between January and February since 2012. The price movements reflect the amount of discounting observed in the datasets.
The upward effect on the change in the headline rate between January and February 2023 was principally from women's clothing, where prices rose by more this year than a year ago.
Recreation and culture
These upward movements were partially offset by a downward effect from recreation and culture, where prices rose by 4.1% in the year to February 2023, down from 5.0% in January. The easing in the annual rate came largely from recording media (particularly DVDs), where prices fell by 2.8% in the year to February 2023 compared with a smaller fall of 0.6% in January. The movements in this class depend, in part, on the composition of bestseller charts. Short-term movements in the rate should therefore be interpreted with a degree of caution. Other smaller downward effects within recreation and culture came from games, toys and hobbies, and equipment for sport and open-air recreation.
Transport
The annual inflation rate for transport eased slightly from 3.4% in January 2023 to 3.1% in February 2023, down for an eighth consecutive month from a recent peak of 15.2% in June 2022, and the lowest rate since February 2021. This relatively small change in the annual rate hides larger changes in the more detailed transport categories. The driver behind the easing in the rate between January and February 2023 was motor fuels.
Overall, the annual rate for motor fuels eased from 7.7% to 4.6% between January and February 2023. Average petrol and diesel prices stood at 148.0 and 169.5 pence per litre, respectively, in February 2023, compared with 147.6 and 151.7 pence per litre in February 2022. Petrol prices fell by 1.4 pence per litre between January and February 2023, compared with a rise of 2.5 pence per litre between the same two months a year ago. Similarly, diesel prices fell by 2.6 pence per litre this year compared with a rise of 2.8 pence per litre a year ago.
Partially offsetting the downward effect from motor fuels, there were upward pushes between January and February 2023 from second-hand cars and transport services. Second-hand car prices fell by 5.9% in the year to February, compared with a larger fall of 7.2% in the year to January. The annual rate for transport services rose from 7.6% to 7.8% between January and February.
Read the full report at
https://www.ons.gov.uk/economy/inflationandpriceindices/bulletins/consumerpriceinflation/february2023