Consumer Price Inflation, UK - March 2024 - 3.2% Down From 3.4% In February
17th April 2024
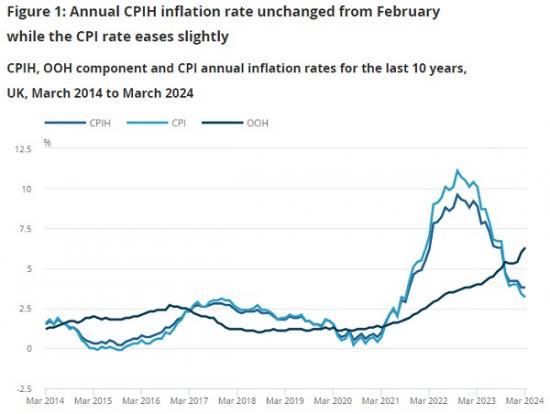
The Consumer Prices Index including owner occupiers' housing costs (CPIH) rose by 3.8% in the 12 months to March 2024, unchanged from February.
On a monthly basis, CPIH rose by 0.6% in March 2024, compared with a rise of 0.7% in March 2023.
The Consumer Prices Index (CPI) rose by 3.2% in the 12 months to March 2024, down from 3.4% in February.
On a monthly basis, CPI rose by 0.6% in March 2024, compared with a rise of 0.8% in March 2023.
The largest downward contribution to the monthly change in both CPIH and CPI annual rates came from food, with prices rising by less than a year ago, while the largest, partially offsetting, upward contribution came from motor fuels, with prices rising this year but falling a year ago.
Core CPIH (excluding energy, food, alcohol and tobacco) rose by 4.7% in the 12 months to March 2024, down slightly from 4.8% in February; the CPIH goods annual rate slowed from 1.1% to 0.9%, while the CPIH services annual rate was unchanged at 6.0%.
Core CPI (excluding energy, food, alcohol and tobacco) rose by 4.2% in the 12 months to March 2024, down from 4.5% in February; the CPI goods annual rate slowed from 1.1% to 0.8%, while the CPI services annual rate eased slightly from 6.1% to 6.0%.
The Consumer Prices Index including owner occupiers' housing costs (CPIH) rose by 3.8% in the 12 months to March 2024, unchanged from February but down from a recent peak of 9.6% in October 2022.
Our indicative modelled consumer price inflation estimates suggest that the October 2022 inflation rate was the highest in over 40 years (the CPIH Accredited Official Statistic series begins in January 2006). The annual rate in March 2024 equalled that of February 2024 and October 2021. The rate was last lower in September 2021.
The monthly CPIH rate in March 2024 was 0.6%, compared with 0.7% a year earlier.
The owner occupiers' housing costs (OOH) component of CPIH rose by 6.3% in the 12 months to March 2024, up from 6.0% in February. This is the highest annual rate since July 1992 in the constructed historical series. OOH costs rose by 0.6% on the month, compared with a 0.3% increase between February and March 2023.
The Consumer Prices Index (CPI) rose by 3.2% in the 12 months to March 2024, down from 3.4% to February and well below its recent peak of 11.1% in October 2022. Our indicative modelled consumer price inflation estimates suggest that the October 2022 peak was the highest rate in over 40 years (the CPI Accredited Official Statistic series begins in January 1997). The annual rate in March 2024 was the lowest since September 2021, when it was 3.1%.
The easing in the annual rate between February and March 2024 was a result of prices rising by 0.6% on the month, compared with a rise of 0.8% a year earlier.
The main drivers of the annual inflation rate for CPIH and CPI are the same where they are common to both measures. However, the OOH component accounts for approximately 16% of the CPIH and is the main driver for differences between the CPIH and CPI inflation rates. This makes CPIH our most comprehensive measure of inflation. We cover this in more detail in Section 4: Latest movements in CPIH inflation and provide a commentary on the CPI in Section 5: Latest movements in CPI inflation. We also cover both CPIH and CPI in Section 3: Notable movements in prices, though the figures reflect CPIH.
Notable movements in prices
The unchanged Consumer Prices Index including owner occupiers' housing costs (CPIH) annual inflation rate in March 2024 reflected offsetting contributions from the different product groups. There were downward contributions from five divisions, most notably food and non-alcoholic beverages, offset by upward contributions from three divisions, particularly housing and household services.
Food and non-alcoholic beverages
Prices for food and non-alcoholic beverages rose by 4.0% in the year to March 2024, down from 5.0% to February. The March figure is the lowest annual rate since November 2021. The rate has eased for the 12th consecutive month from a recent high of 19.2% in March 2023, the highest annual rate seen for over 45 years.
Prices rose by 0.2% between February and March 2024, compared with a monthly rise of 1.1% a year ago. Prices have been relatively high but stable since early summer 2023, rising by less than 2% between May 2023 and March 2024. This compares with a sharp rise of around 22% seen between March 2022 and May 2023.
The annual rates for most types of food product eased between February and March 2024, with the largest effects coming from bread and cereals, and meat. Prices for bread and cereals rose by 0.2% on the month, compared with a rise of 2.2% a year ago, resulting in an annual rate in March 2024 of 4.0% - the lowest since January 2022. Prices of some bakery products, such as chocolate biscuits and crumpets, fell between February and March 2024 but rose between the same period a year ago.
Meat prices fell by 0.5% between February and March this year, compared with a rise of 1.4% a year ago. This resulted in an annual rate of 3.1% in the year to March 2024, the lowest rate since November 2021. The main downward effect behind the easing in the rate came from pork products.
Overall, the annual rate eased in 8 of the 11 food and non-alcoholic beverages classes, the exceptions being vegetables, hot beverages, and soft drinks.
Furniture and household goods
Prices of furniture and household goods fell by 0.9% in the year to March 2024, compared with a small rise of 0.1% to February. This is the largest annual fall in prices since September 2016 and the first negative rate since December 2020. On a monthly basis, prices rose by 0.3% between February and March 2024, compared with a rise of 1.3% a year ago.
The easing in the annual rate reflected small downward effects from a range of classes, principally furniture and furnishings, and non-durable household goods. Prices of furniture and furnishings fell by 2.3% in the year to March 2024, compared with an annual fall of 1.6% to February. Prices of non-durable household goods rose by 1.1% in the year to March, compared with a larger rise of 4.5% to February. The non-durable household goods downward effect was caused by price movements for household cleaning products.
Clothing and footwear
Prices of clothing and footwear rose by 3.9% in the year to March 2024, down from 5.0% the previous month. The rate in March was the lowest since November 2021. On a monthly basis, prices rose by 0.6% between February and March 2024, compared with a rise of 1.6% a year ago. This reflects the incidence of discounting in the dataset, which fell by less this year than a year ago. Prices tend to rise between February and March as new season stock continues to enter the shops but the rise in 2024 was less than in most recent years.
The downward effect came principally from women's clothing and footwear, with prices rising on the month but by less than a year ago.
Housing and household services
The overall easing in the inflation rate was partially offset by an upward effect from housing and household services, whose annual rate was 3.1% in March 2024, up from 2.9% to February. This compares with a recent annual peak of 11.8% observed in January and February 2023.
The increase in the annual rate reflected an upward effect from owner occupiers' housing (OOH) costs, which rose by 6.3% in the year to March 2024, compared with a rise of 6.0% to February. The OOH annual rate was last higher in July 1992.
Transport
Prices in the transport division fell by 0.1% in the year to March 2024, compared with a fall of 0.4% to February. The annual rate has been negative for the latest five months.
The small overall change in the annual rate masks offsetting movements in some of the transport categories, with a large upward effect from motor fuels partially offset by smaller downward effects from second-hand cars, rail fares and air fares.
The average price of petrol rose by 2.6 pence per litre between February and March 2024 to stand at 144.8 pence per litre, down from 146.8 pence per litre in March 2023. Diesel prices rose by 2.8 pence per litre in March to stand at 154.1 pence per litre, down from 166.5 pence per litre in March 2023. These movements resulted in overall motor fuel prices falling by 3.7% in the year to March 2024, compared with a fall of 6.5% in February.
There was also a small upward effect from maintenance and repairs, where prices rose by 0.8% in March 2024, compared with a monthly fall of 0.6% a year ago. This was because prices of roadside recovery services rose this year but fell a year ago.
Second-hand car prices rose by 0.2% between February and March 2024, compared with a larger rise of 1.0% a year ago. On an annual basis, prices fell by 8.1% in the year to March 2024, compared with a fall of 7.3% to February. The annual rate has been negative for eight consecutive months.
The small downward effects from rail fares and air fares resulted from prices rising on the month this year by less than a year ago. The annual rise in regulated rail fares in England in March 2024 was capped at a lower rate than in March 2023. Air fares rose by just 0.1% between February and March this year, compared with a 7.7% monthly increase a year ago, with the main downward effect coming from European routes.
Latest movements in CPIH inflation
Figure 5 shows the annual inflation rates for the Consumer Prices Index including owner occupiers' housing costs (CPIH) series for all goods and all services, together with CPIH excluding energy, food, alcohol and tobacco (often referred to as core CPIH). The CPIH inflation rate is added for comparison.
The core CPIH annual inflation rate was 4.7% in March 2024, which was the lowest rate since February 2022. It is down slightly from 4.8% in February 2024 and from a recent high of 6.5% in May 2023, which was the highest rate since November 1991, when it was also 6.5% in the constructed historical series.
The CPIH all goods index rose by 0.9% in the 12 months to March 2024, down from 1.1% in February, and the lowest rate since March 2021. The slowing in the annual rate has been caused principally by downward contributions to the change from food and non-energy industrial goods, particularly household goods, and clothing and footwear goods. These have been partially offset by an upward contribution from energy, principally from motor fuels.
The CPIH all services index rose by 6.0% in the 12 months to March 2024, unchanged from February. The largest upward contribution to change came from housing services, particularly owner occupiers' housing costs. This was offset by downward contributions from transport services, and catering services.
Figure 6 shows how each of the main groups of goods and services contributed to the change in the annual CPIH inflation rate between February and March 2024. To understand what has changed the inflation rate between these months, we can look at the differences between the contributions each of the 12 divisions made to the rate in February 2024 and the rate in March 2024. These differences sum to the change in the annual CPIH rate between the latest two months. Between February and March, the contributions to change largely offset and, partly because of rounding, the rate remained at 3.8%.
The unchanged rate in March 2024 reflected downward contributions from five divisions, offset by upward contributions from three divisions. The largest downward contributions came from food and non-alcoholic beverages, furniture and household goods, and clothing and footwear. The largest upward contributions were from housing and household services, transport, and communication.
Figure 7 shows the extent to which the distinct categories of goods and services have contributed to the overall annual CPIH inflation rate over the last two years. The contribution of each category to the annual rate depends on the price movement in that category as well as its weight, which is updated annually. Contributions help to explain what is driving the inflation rate by expressing it as the additive sum of its parts. For any one month, when added together, the contributions from the 12 divisions sum to the overall CPIH inflation rate, for example, 3.8% in March 2024.
The largest upward contributions to the annual CPIH inflation rate in March 2024 came from housing and household services, restaurants and hotels, and recreation and culture. The contribution from housing and household services rose from 0.87 percentage points in February 2024 to 0.94 percentage points in March, the contribution from restaurants and hotels eased slightly to 0.67 percentage points, and the contribution from recreation and culture was unchanged at 0.63 percentage points.
The contribution from food and non-alcoholic beverages eased for the 12th consecutive month, from a recent high of 1.76 percentage points in March 2023 to 0.39 percentage points in March 2024. This was the lowest contribution from this division since January 2022, when it was also 0.39 percentage points.
Small negative contributions to the annual CPIH inflation rate came from furniture and household goods, and transport. This was the first negative contribution from furniture and household goods since December 2020. Transport provided a negative contribution for the fifth consecutive month, albeit the negative contribution has become smaller, from -0.16 percentage points in November 2023 to a marginal -0.01 percentage points in March 2024.
To read the full ONS article with graphs and links go HERE