How Have The Size And Shape Of The UK State Changed?
10th June 2024
A report by the Instituee for Fiscal Studies. It describe how the size and shape of the state have changed since the mid 1950s and over the 2019-24 parliament, and discuss the future outlook.
Key Findings
1. Government spending as a proportion of national income - a measure of the size of the state - stayed roughly stable between the mid 1950s and the COVID-19 pandemic, outside of major crises. Spending has fluctuated around 40% of national income.
2. This stability masks considerable changes in the composition of spending before the pandemic. Health spending rose enormously from 2.8% of national income in 1955-56 to 7.3% in 2019-20, a rise of £126 billion in this year's terms. The ‘peace dividend' is a key reason why this has been possible without increases to total spending: defence spending fell sharply from 7.6% of national income in 1955-56 to 1.9% immediately pre-pandemic, or by £160 billion in this year's terms. Even before the pandemic, it was clear that the declines in defence spending - and more recent declines in debt interest spending - could not continue.
3. The state was the same size in 2019-20 as it was in 2007-08, on the eve of the financial crisis. There have been changes in the composition of spending over this period, too. Health spending rose by nearly 1% of national income, while spending on education fell by a similar amount. Spending on social security also dropped as significant cuts to working-age welfare benefits were implemented.
4. Over this parliament, spending has grown by 4.5% of national income (£124 billion in today's terms), or by 0.9 percentage points on average each year. This is significantly higher growth than under any other post-war Conservative parliament, and is the fourth-fastest growth in the size of the state under any parliament in the post-war era.
5. The rise in the size of the state during this parliament was also much larger than anticipated before the pandemic. Four-fifths of the rise in spending as a share of GDP was not forecast before the pandemic. Both faster-than-anticipated spending growth and slower-than-forecast GDP growth have played a role.
6. Both debt interestandspending on social security benefits and the state pension have grown significantly faster than was expected in March 2020. Before the pandemic, these areas of spending were expected to remain stable - or fall – as a share of GDP during the parliament. Instead, debt interest spending has risen by 1.5% (£41 billion), and social security spending 1.2% (£33 billion), of national income between 2019–20 and 2024–25. In both cases, it seems unlikely that the rise in spending will prove to be an entirely transitory feature of the pandemic.
7. On current plans, the size of the state is set to fall slightly after this parliament, but remain at levelshigher than its pre-pandemic level or the long-run average. In 2028–29, spending is forecast to be 42.5% of national income, 2.9% of national income (£80 billion) above pre-pandemic levels. Debt interest payments will account for around three-fifths of that increase, but even spending excluding debt interest payments spending is forecast to be 1.2% of national income (£33 billion) above pre-pandemic levels.
8. A combination of struggling public services, demographic pressures and geopolitical uncertainty would make it hard to cut the size of the state further. Indeed, there does not seem to be ambition from either main party to cut the scope of the state. In this parliament, new childcare and social care policies have added to what the state does.
9. Spending plans currently pencilled in could be described as unrealistically tight. If all departmental spending were to be protected from real-terms cuts, then this would require a top-up to current plans of around £30 billion in cash terms, and in 2028–29 spending would be closer to 43.4% of national income, 3.8% of national income (£107 billion) higher than before the pandemic.
10. Parties have a choice. They can cut the scope of what the state provides, perhaps in an attempt to return the state closer in size to its post-war average. They can raise taxes perhaps to maintain real-terms levels of departmental funding. Or they can borrow more – temporarily postponing tax rises or spending cuts, which would fall on future generations – in order to increase spending, relying on luck to avoid breaching fiscal rules to which both have committed, and increasing fiscal risks in the process. Both main parties should be clear on which of these three options they intend to take.
1. Introduction
For a remarkably long time, the UK state remained at around the same size. Government spending outside of economic crises hovered around 40% of national income between the mid 1950s and the COVID-19 pandemic. This has been in spite of large, epochal changes to what the state does. Persistent rises in spending on social security benefits, state pensions and health and social care through this period were largely offset by a large reduction in spending on defence and a more recent fall in debt interest spending.
Since 2019, the size of the state has grown considerably, not only reaching historic heights during the pandemic but lingering at a higher level thereafter. It seems unlikely – though not impossible – that we will return to the size of the state that we had been used to seeing pre-pandemic, at least without cutting the scope of what the state provides.
In this piece, we will seek to answer three key questions. First, how did the size of the state remain so constant for so long between the Second World War and the COVID-19 pandemic? Second, what has happened to the size of the state over the 2019–24 parliament, and why? Third, what can these developments tell us about the future, and the choices faced by both main parties?
2. Pre-pandemic trends: 1955–56 to 2019–20
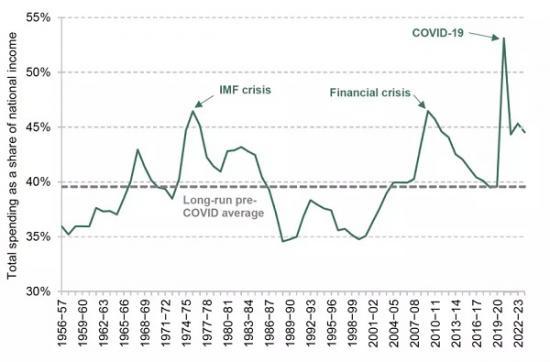
Figure 1 shows the size of the state, measured by government spending as a share of national income. While spending as a share of national income has fluctuated considerably between the mid 1950s and 2022–23, this fluctuation has been around the long-run average of 40%. Notably, the state was almost exactly the same size in 2007–08 as in 2019–20, on the eve of the pandemic.
To some extent, the fluctuations in the size of the state over time reflect fluctuations of the economic cycle. During recessions – in the mid 1970s, early 1980s, early 1990s, the late 2000s or during the COVID-19 crisis – national income falls, and so a government spending a given amount of money will account for a larger fraction of the overall economy. Some components of spending also tend to rise during recessions – for example, spending on unemployment benefits. When the economy booms, as in the late 1980s, spending as a share of national income will similarly mechanically fall. To some extent, too, fluctuations in the size of the state are a matter of different governments' political priorities. For example, the steady rise in the size of the state between 1999–2000 and 2007–08 can largely be explained by different policy priorities and ambitions under the Labour governments at the time.
But the key point here is that spending as a share of national income between the mid 1950s and the COVID-19 pandemic has hovered around 40%, only reaching levels significantly higher than this during economic crises. This is a remarkable fact in light of huge changes to government, the economy and society. Over the same time, between 1952 and 2022, infant mortality fell from 29.1 per 1,000 live births to 3.4, the proportion of energy generated from coal fell from 88.5% to 6.5%, and the number of women at university rose from 23,000 to 1,569,000 (Turner, 2022).
Changes in the composition of spending
While spending in the post-war period has stayed relatively constant, there have been much more significant changes in the composition of spending. It is therefore useful to look at the factors that allowed the size of the UK state to remain so remarkably stable over many decades.
We can decompose total spending by function. The largest of these areas include health (18.5% of total spending in 2019–20, immediately before the pandemic), pensioner social security benefits and state pensions (14.4% of total spending), social security benefits for children and working-age people (11.4% of total spending), education (10.2% of total spending) and defence spending (4.7% of total spending).
Panel A of Figure 2 splits spending into various functions at five points in the last 40 years: 1979–80, 1989–90, 1999–2000, 2007–08 and 2019–20. We use 2007–08 rather than 2009–10 as the aim is to illustrate the broader change in the composition of spending, and 2009–10 was a historically unusual year, mid financial crisis (as is clear from Figure 1). The size of the state is similar in these five years, but the shape is not.
Read the full report HERE
Pdf 31 Pages