The Government's Record On Tax 2010-24
11th June 2024
An assessment of tax policy changes and the policymaking process from 2010 to 2024.
This report gives a high-level overview of tax policy across the period 2010 to 2024. An appendix summarises the main tax policy changes.
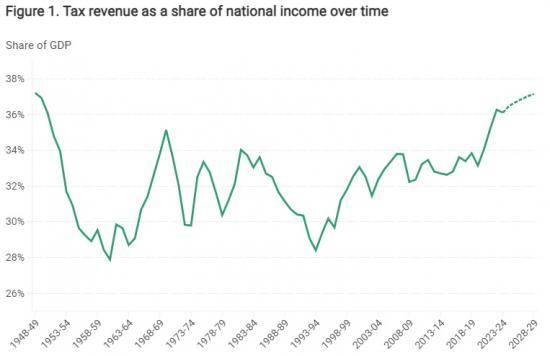
There are some clear distinctions between the governments before 2019 (including the coalition government of 2010-15) and the governments from 2019. Most notably, tax revenue as a share of national income was remarkably stable until 2019 but has increased sharply since and is now higher than at any point since 1948. There were also big swings in the direction of some major policies.
The income tax personal allowance was increased for years before 2019 but is now on a declining path. The main rate of corporation tax was cut substantially until 2017 and then increased sharply in 2023. Rates of National Insurance contributions (NICs) continued their long-run upward trend until recently but have now been sharply reduced.
But there are also some common themes across the 14-year period. Overall, there has been a common trend towards increasing direct taxes on high-income individuals, while cutting them on low and middle earners. In fact, remarkably, despite the overall tax burden reaching historical highs, income tax and employee NICs now take a smaller fraction of the earnings of a single full-time median earner with no children than at any time for almost 50 years.
Tax policy has been changed such that we are raising less on average earnings but more from higher earners, more from other taxes, and more overall.
Another common theme has been a move towards greater complexity. We have seen more than a dozen new taxes introduced since 2010, and many new rates and reliefs added to existing taxes. The tax code has never been longer. In general, this added complexity has not resulted in a tax system that is fairer or more economically efficient. In fact, despite all of the policy change, none of the major tax policy challenges that existed in 2010 has been substantively addressed. That is not to say that there have been no positive developments in tax design - there have been some welcome improvements in some areas.
But these have tended to be small relative to the scale of the underlying challenges. Successive governments have missed opportunities to address poor tax design head on. Many of the tax policy challenges that were known about in 2010, including around how tax will adapt to addressing climate change, are now more urgent.
Key findings
1. Tax revenue as a share of national income was stable (at 33%) from 2010 to 2019 but is now 36% and rising. This is the highest tax burden since 1948. The parliament that started in 2019 saw the biggest rise in the tax take of any parliament in modern history.
2. Relative to 2010, more revenue is now being raised from income tax, VAT, corporation tax and capital taxes. Less is being raised from fuel and tobacco duties and business rates.
3. Big changes in personal tax thresholds have led to the share of adults paying income tax falling from 61% in 2010-11 to 58% in 2019-20 before rising to an expected 66% in 2028-29.
4. The share of over-65s paying income tax has risen rapidly from 48% in 2010-11 to 65% in 2023-24. For the first time ever, the share of over-65s paying income tax is higher than the share of working-age adults paying income tax (63%). This trend is due to the combined effect of relatively strong income growth among pensioners and the phasing-out of the (previously higher) pensioner personal allowance.
5. The number of people paying the higher or additional rate of income tax has more than doubled, from 6% (3.3 million) of the adult population in 2010-11 to 13% (7.4 million) now and is expected to reach 15% (8.7 million) by 2028-29.
6. Income taxes have risen at the top but been cut for most. The share of income tax paid by the top 10% of income tax payers has risen from 54% in 2010–11 to 60% in 2023–24. Income tax and employee National Insurance contributions take a smaller fraction of the earnings of a single full-time median earner with no children than at any time for almost 50 years.
7. There have been big swings in policy direction. Big reversals in the path of the personal allowance and the main corporation tax rate are two examples among many.
8. The tax system has become more complex. Governments have added new taxes and new differentiated rates, allowances and reliefs to existing taxes.
9. The tax gap – the gap between the tax HMRC actually collects and the amount it thinks theoretically ought to be paid – has been cut substantially. But HMRC's customer service levels have reached an all-time low.
Personal allowance went up a lot for the under-65s and then down again for all
The income tax personal allowance was increased sharply during the 2010s, rising by 61% in real terms between 2010–11 and 2019–20 (mostly in the first half of the decade). The cash freeze in the allowance that has been in place since 2021, while a much bigger real-terms cut than originally intended (because of higher-than-expected inflation), is still on course to reverse only about half of that increase (see Figure 4).
As we might expect, the proportion of adults subject to income tax fell when the personal allowance was being increased, and is rising now the allowance is being cut. However, while the rise in the personal allowance during the 2010s has been only partly reversed, the fall in the number of taxpayers during the 2010s (from 61% of adults in 2010–11 to 58% in 2013–14, where it stayed for the rest of the decade) has been eclipsed by the rise during the 2020s (from 58% to a projected 66%).
There are two main reasons for this.
First, real income growth. Since incomes tend to grow faster than prices (albeit less so since 2010 than in previous eras), the number of people with incomes above the personal allowance would tend to rise even if the allowance were increased in line with prices (which is the default). The share of the population paying income tax need not therefore be lower than in 2010–11 even though the personal allowance is higher. A rise in the employment rate since 2010–11 has also played a part.
Second, pensioners. People aged 65 and over used to benefit from a higher personal allowance than younger people. That allowance was not increased alongside the main personal allowance in the early 2010s, until the two allowances converged (see Figure 4). Pensioners thus saw little real-terms increase in their personal allowance during the 2010s, but are seeing a real-terms reduction now.
As a result of that – and the fact that pensioners' incomes have risen faster than the working-age population's, on average – the proportion of people aged 65 or over paying income tax has grown rapidly in both the 2010s and the 2020s, rising from 48% in 2010–11 to 65% in 2023–24 (see Figure 5). Indeed, in 2023–24, for the first time ever, people aged 65 or over were more likely to pay income tax than those aged 16 to 64.
[url=https://ifs.org.uk/sites/default/files/2024-06/The-governments-record-on-tax-2010%E2%80%9324-IFS-Report.pdf]Readteh full IFS report HERE[/url]
Pdf 29 Pages