Consumer Price Inflation, UK - June 2024 - 2.0% in the 12 months to June 2024, the same rate as the 12 months to May 2024
17th July 2024
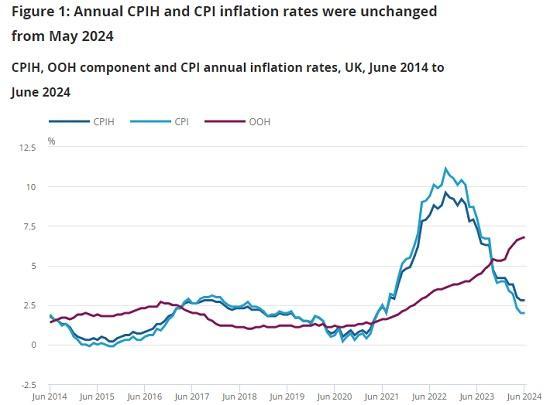
The Consumer Prices Index including owner occupiers' housing costs (CPIH) rose by 2.8% in the 12 months to June 2024, the same rate as the 12 months to May 2024.
On a monthly basis, CPIH rose by 0.2% in June 2024, the same rate as in June 2023.
The Consumer Prices Index (CPI) rose by 2.0% in the 12 months to June 2024, the same rate as the 12 months to May 2024.
On a monthly basis, CPI rose by 0.1% in June 2024, the same rate as in June 2023.
The largest upward contribution to the monthly change in both CPIH and CPI annual rates came from restaurants and hotels, where prices of hotels rose more than a year ago; the largest downward contribution came from clothing and footwear, with prices of garments falling this year having risen a year ago.
Core CPIH (excluding energy, food, alcohol and tobacco) rose by 4.2% in the 12 months to June 2024, the same rate as in May; the CPIH goods annual rate fell from negative 1.3% to negative 1.4%, while the CPIH services annual rate rose from 5.9% to 6.0%.
Core CPI (excluding energy, food, alcohol and tobacco) rose by 3.5% in the 12 months to June 2024, the same rate as in May; the CPI goods annual rate fell from negative 1.3% to negative 1.4%, while the CPI services annual rate remained at 5.7%.
The Consumer Prices Index including owner occupiers' housing costs (CPIH) rose by 2.8% in the 12 months to June 2024, the same rate as the 12 months to May, and down from a recent annual peak of 9.6% in October 2022.
Our Consumer price inflation, historical estimates and recent trends article suggests that the October 2022 inflation rate was the highest in over 40 years (the CPIH accredited official statistic series begins in January 2006). The annual rate in June 2024 has not been lower since July 2021, when it was 2.1%.
The monthly CPIH rate in June 2024 was 0.2%, the same rate as a year earlier.
The owner occupiers' housing costs (OOH) component of CPIH rose by 6.8% in the 12 months to June 2024, up from 6.7% in the 12 months to May. This is the highest annual rate since July 1992 in the constructed historical series. OOH costs rose by 0.6% on the month, compared with a 0.5% increase between May and June 2023.
The Consumer Prices Index (CPI) rose by 2.0% in the 12 months to June 2024, the same rate as the 12 months to May, and well below its recent annual peak of 11.1% in October 2022. Our indicative modelled consumer price inflation estimates suggest that the October 2022 peak was the highest rate in over 40 years (the CPI accredited official statistic series begins in January 1997). The annual rate in June 2024 has not been lower since April 2021, when it was 1.5%.
The monthly CPI rate in June 2024 was 0.1%, the same rate as it was in June 2023.
The main drivers of the annual inflation rate for CPIH and CPI are the same where they are common to both measures. However, the OOH component accounts for approximately 16% of the CPIH and is the main driver for differences between the CPIH and CPI inflation rates. This makes CPIH our most comprehensive measure of inflation. We describe this in more detail in Section 4: Latest movements in CPIH inflation and provide a commentary on the CPI in Section 5: Latest movements in CPI inflation. We also discuss both CPIH and CPI in Section 3: Notable movements in prices, though the figures reflect CPIH.
Notable movements in prices
The annual CPIH inflation rate in June 2024 reflected downward contributions from five divisions, offset by upward contributions from four. The largest upward effects came from restaurants and hotels, transport and housing and household services. The largest downward effect came from clothing and footwear.
Restaurants and hotels
Prices for restaurants and hotels rose by 0.9% between May and June this year, compared with a lower monthly rise of 0.5% a year ago. The annual rate rose to 6.3% in the year to June 2024, up from 5.8% in the year to May.
The rise in the annual rate was almost entirely because of the price of hotels, which saw a monthly rise of 8.8%, a higher rate than the 1.7% a year earlier. This rise was partially offset by the price of restaurants and cafes which saw a monthly rise of 0.3%, lower than the 0.5% rise a year earlier.
Transport
Prices in the transport division rose by 0.7% in the year to June 2024, compared with a rise of 0.3% in the year to May. This is the largest annual price rise since September 2023, where it was also 0.7%. On a monthly basis, prices fell by 0.2% this year, compared with a fall of 0.7% a year ago.
The increase in the annual rate was mainly because of second hand cars, where prices decreased by 0.3% on the month compared with a decrease of 1.9% a year ago. Second hand car prices decreased by 9.8% in the year to June 2024, the 11th consecutive month of annual decrease.
Maintenance and repairs of personal transport equipment and air fares also provided upward effects, although these were smaller in magnitude. Railway fares were one of the few categories to provide a counteracting negative effect.
The average price of petrol fell by 3.0 pence per litre between May and June 2024 to 145.8 pence per litre, up from 143.0 pence per litre in June 2023. Diesel prices fell by 4.8 pence per litre in June 2024 to stand at 151.5 pence per litre, up from 145.7 pence per litre in June 2023. These movements resulted in overall motor fuel prices rising by 2.6% in the year to June 2024, compared with a rise of 2.3% in the year to May.
Clothing and footwear
Prices in the clothing and footwear division rose by 1.6% in the year to June 2024, compared with a rise of 3.0% in the year to May. On a monthly basis, prices fell by 1.2% this year, compared with a 0.2% rise a year ago. The fall in the annual rate was the result of downward effects from garments for women, garments for children, footwear for women, and garments for men. Prices in all of these categories apart from garments for children saw price falls in June 2024 coupled with a rise in the monthly price in June 2023. Monthly prices for garments for children fell in June 2024 at a greater rate than the fall in June 2023.
These price falls in the latest month may reflect a larger proportion of sales markers (indicating a temporary reduction in prices) in this division than occurred in June 2023.
Three items making particularly strong downward contributions were women's sportswear shorts, women's exercise leggings and girl's fashion tops. These items saw strong double digit monthly growth in June 2023 compared to price falls in June 2024.
Food and non-alcoholic beverages
Prices of food and non-alcoholic beverages rose by 1.5% in the year to June 2024, down from 1.7% in the year to May. The June figure is the lowest annual rate since October 2021, when it was 1.3%, and compares with 17.4% a year ago. The annual rate has eased for the 15th consecutive month from a recent high of 19.2% in March 2023, the highest annual rate seen for over 45 years.
Prices rose by 0.2% in June 2024, compared with a monthly rise of 0.4% a year ago. Prices have been relatively high but stable since early summer 2023, compared with sharp rises over the previous 12 months.
Annual rates eased in 6 of the 11 food and non-alcoholic beverages classes, strengthened in 4 classes and remained the same in 1. The main downward effects came from a combination of bread and cereals, meat, and fruit.
Prices of meat fell this year, having risen last year, while prices of fruit fell at a faster rate than last year. While prices of bread and cereals rose on the month this year, the increase was at a slower rate than a year ago. The resulting annual rates were the lowest since October 2021 for meat (0.9%) and for bread and cereals (0.5%), and since August 2021 for fruit (1.6%).
The products making the largest downward contribution to the annual rate included packs of individual cakes, and crumpets. The largest upward contributions came from sponge cake, sugarless breakfast cereal, tinned tuna, kettle chips, and orange juice.
Read the full ONS report HERE