Households' Finances And Saving UK - 2020 To 2024
31st July 2024

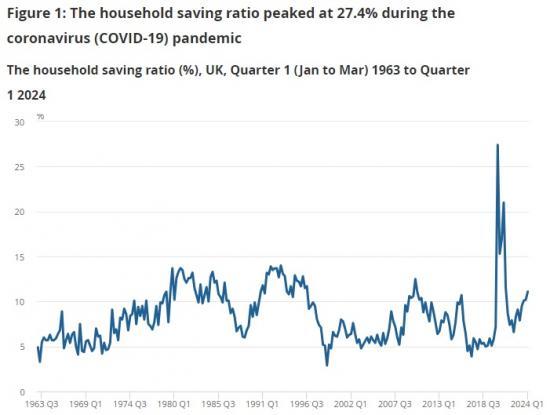
The UK household saving ratio peaked at 27.4% in Quarter 2 (Apr to June) 2020, mainly because of the suppression of consumption opportunities during the coronavirus (COVID-19) pandemic;
Having decreased to 6.6% in Quarter 2 2022, the ratio has risen steadily to 11.1% in Quarter 1 (Jan to Mar) 2024.
These increases have coincided with cost of living pressures, weak consumer confidence and slower growth in household consumption.
Estimates of the total value of excess saving accumulated by UK households since the start of the pandemic range from £143 billion to £338 billion (7.9% to 18.7% of household annual total resources).
UK households have been reluctant to spend these accumulated savings, unlike in the US where it has been an important factor in supporting household consumption and economic growth.
Overview of household saving
The household saving ratio is the proportion of the household sector's total resources that are available but have not been used for consumption.
Total resources, which is closely related to disposable income, consist of:
labour income - the total compensation of employees, so not just wages and salaries but also other employment-related benefits, such as pension contributions
non-labour income - this includes the operating surpluses from household businesses, the income of the self-employed (mixed income), the net income from the ownership of financial assets such as interest payments and dividends, and changes in the value of household-owned pension funds
net transfers which consist primarily of social benefits and pensions received and the payment of taxes and social contributions; note that furlough and other income-support payments received during the coronavirus (COVID-19) pandemic would be included in labour and mixed income rather than this component
Figure 1 shows the household saving ratio over the last 50 years. The ratio exhibits a distinct cyclical pattern, generally rising in or around recessions as households reduce consumption spending. This article will focus on two recent periods where there have been significant increases in the household saving ratio.
First, during 2020 and 2021 when restrictions on social interactions and physical movement introduced during the pandemic, along with closure of physical stores and customer-facing services, contributed to a spike in the saving ratio which reached a peak of 27.4% in Quarter 2 (Apr to June) 2020.
Second, the significant increase in the saving ratio after the pandemic, from 6.6% in Quarter 2 2022 to 11.1% in Quarter 1 (Jan to Mar) 2024. This period was associated with a significant increase in the cost of living and rising interest rates.
Read the full ONS report HERE
