Retail sales, Great Britain - April 2025
27th May 2025
Retail sales volumes (quantity bought) are estimated to have risen by 1.2% in April 2025. This follows a rise of 0.1% in March 2025 (revised down from a rise of 0.4% in our last bulletin).
Food store sales volumes grew strongly in April 2025, which retailers attributed to the good weather.
Sales volumes rose by 1.8% in the three months to April 2025, when compared with the three months to January 2025.
Sales volumes rose by 1.2% during April 2025, following a 0.1% rise in March. Sales volumes rose by 5.0% in the year to April 2025.
Volumes were up by 0.3%, compared with their pre-coronavirus (COVID-19) pandemic level in February 2020, reaching their highest level since July 2022.
Four months of rising sales volumes led to a 1.8% rise across the three months to April 2025, when compared with the three months to January 2025. This was the largest three-monthly rise since July 2021. There was a 2.6% rise in sales volumes compared with the same period last year, the largest since March 2022.
Food stores sales volumes rose by 3.9%, mostly recovering from falls in February and March 2025. Supermarkets, specialist food stores such as butchers and bakers, and alcohol and tobacco stores all grew during the month, with some retailers attributing this to the good weather.
Non-food stores sales volumes (the total of department, clothing, household and other non-food stores) fell by 0.7% over the month. This was because of falls in clothing stores and other non-food stores (such as sports and games retailers, and second-hand goods stores). These falls in sales volumes mainly followed strong growth in March 2025. Sales for department stores and household goods stores rose on the month, with retailer comments again mentioning the good weather.
Online retail values
Data on retail sales
Data sources and quality
Cite this statistical bulletin
Print this Statistical bulletin
Download as PDF
1.Overview
Retail sales volumes (quantity bought) are estimated to have risen by 1.2% in April 2025. This follows a rise of 0.1% in March 2025 (revised down from a rise of 0.4% in our last bulletin).
Food store sales volumes grew strongly in April 2025, which retailers attributed to the good weather.
Sales volumes rose by 1.8% in the three months to April 2025, when compared with the three months to January 2025.
Back to table of contents
2.Retail sales in April
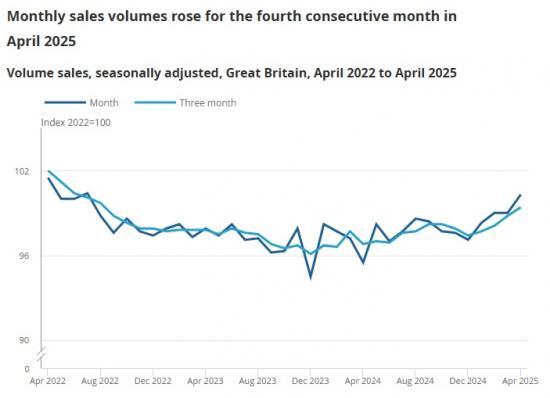
Monthly sales volumes rose for the fourth consecutive month in April 2025
Volume sales, seasonally adjusted, Great Britain, April 2022 to April 2025
MonthThree monthApr 2025Dec 2024Aug 2024Apr 2024Dec 2023Aug 2023Apr 2023Dec 2022Aug 2022Apr 202209096102Index 2022=100
Mar 2023
● Month: 97.3
● Three month: 97.8
Source: Monthly Business Survey, Retail Sales Inquiry from the Office for National Statistics
Download this chartMonthly sales volumes rose for the fourth consecutive month in April 2025
Image .csv .xls
The chart shows the quantity bought in retail sales over time, for both the rolling three-month-on-three-month and month-on-month movements.
Sales volumes rose by 1.2% during April 2025, following a 0.1% rise in March. Sales volumes rose by 5.0% in the year to April 2025.
Volumes were up by 0.3%, compared with their pre-coronavirus (COVID-19) pandemic level in February 2020, reaching their highest level since July 2022.
Four months of rising sales volumes led to a 1.8% rise across the three months to April 2025, when compared with the three months to January 2025. This was the largest three-monthly rise since July 2021. There was a 2.6% rise in sales volumes compared with the same period last year, the largest since March 2022. These data are available in our Retail Sales Index datasets.
Back to table of contents
3.Retail sector volumes
Sales volumes rose across most sectors, with volumes only falling in clothing and other non-food stores
Volume sales, monthly percentage change, seasonally adjusted, Great Britain, April 2025
All retailingAll retailing excluding Automotive fuelFood storesDepartment storesOther non-food storesTextile clothing & footwear storesHousehold goods storesNon-store retailingAutomotive fuel-4-3-2-1012345Percent (%)
All retailing
● Apr-25: 1.2
Source: Monthly Business Survey, Retail Sales Inquiry from the Office for National Statistics
Notes:
Non-store retailing refers to retailers that do not have a store presence. While the majority is made up of online retailers, it also includes other retailers, such as stalls and markets.
More data are available in our Retail Sales Index dataset.
Download this chartSales volumes rose across most sectors, with volumes only falling in clothing and other non-food stores
Image .csv .xls
Food stores sales volumes rose by 3.9%, mostly recovering from falls in February and March 2025. Supermarkets, specialist food stores such as butchers and bakers, and alcohol and tobacco stores all grew during the month, with some retailers attributing this to the good weather.
Non-food stores sales volumes (the total of department, clothing, household and other non-food stores) fell by 0.7% over the month. This was because of falls in clothing stores and other non-food stores (such as sports and games retailers, and second-hand goods stores). These falls in sales volumes mainly followed strong growth in March 2025. Sales for department stores and household goods stores rose on the month, with retailer comments again mentioning the good weather.
The Met Office climate summaries reported that the UK had its sunniest and third warmest April on record, and recorded just over half the normal rainfall seen for April.
Back to table of contents
4.Online retail values
Online sales fell in April 2025 following two months of growth
Value sales, monthly percentage change, seasonally adjusted, Great Britain, April 2025
All retailing excluding Automotive fuelFood storesDepartment storesOther non-food storesTextile clothing & footwear storesHousehold goods storesNon-store retailing-6-4-2024-8Percent (%)
All retailing excluding Automotive fuel
● Apr-25: -0.3
Source: Monthly Business Survey, Retail Sales Inquiry from the Office for National Statistics
Notes:
Non-store retailing refers to retailers that do not have a store presence. While the majority is made up of online retailers, it also includes other retailers, such as stalls and markets.
More data, including the proportion of sales made online, are available in our Retail Sales Index internet sales dataset.
Download this chartOnline sales fell in April 2025 following two months of growth
Image .csv .xls
The amount spent online, known as "online spending values", fell by 0.3% over the month to April 2025. Sales values however rose by 6.1% when comparing April 2025 with April 2024, and by 3.4% when comparing the three months to April 2025 with the three months to January 2025.
Total spend (the sum of in-store and online sales) rose by 0.7% over the month. As a result, the proportion of sales made online fell from 27.1% in March 2025 to 26.8% in April 2025.
Read the full ONS report HERE