
Big Improvement In Public Sector Finances: January 2019
21st February 2019
Deficit continues to fall sharply in 2018-19.
Report from the Office of Budget Responsibility.
Public sector net borrowing (PSNB) is provisionally estimated to have shown a record monthly surplus of £14.9 billion in January. This was £5.6 billion higher than the same month last year and £4.9 billion higher than the average market expectation of £10.0 billion.
• Last month's estimate of PSNB over the first nine months of 2018-19 was revised up £0.1 billion to £36.1 billion.
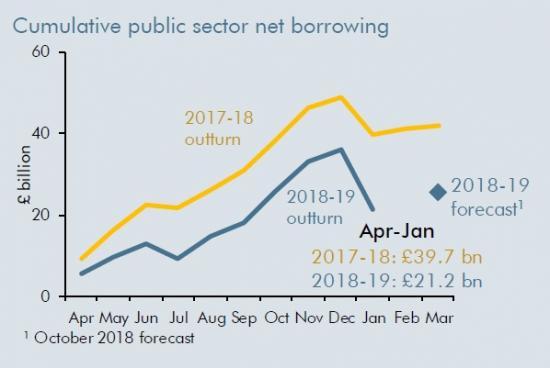
• Year-to-date PSNB stands at £21.2 billion, down £18.5 billion (46.6 per cent) on the same period in 2017-18. Our October EFO forecast of £25.5 billion for 2018-19 as a whole implies a £16.4 billion fall (39.2 per cent) over the full financial year.
• Year-to-date central government receipts (excluding PSNB-neutral transfers related to ‘quantitative easing') are 5.4 per cent up on the same period in 2017-18 - exceeding our full-year forecast of a 4.7 per cent rise (on a like-for-like basis).
• Year-to-date central government spending (excluding PSNB-neutral grants to local authorities) is up 3.0 per cent on last year - slightly less than our full-year forecast of a 3.1 per cent rise (on a like-for-like basis).
• Net debt was 0.8 per cent of GDP lower in January 2019 than a year earlier. This comparison is still being affected by the addition to debt from monetary policy measures.
1. The Office for National Statistics and HM Treasury published their Statistical Bulletin on the January 2019 Public Sector Finances this morning, covering the first ten months of the 2018-19 fiscal year.1 Each month the OBR provides a brief analysis of the data and a comparison with our most recent forecast, currently the October 2018 Economic and fiscal outlook (EFO). This is the final data release before our next forecast on 13 March.
Public sector net borrowing
2. Public sector net borrowing (PSNB) is provisionally estimated to have recorded a surplus of £14.9 billion in January - the largest monthly surplus on record. This surplus was £5.6 billion larger than a year earlier and £4.9 billion above the average market expectation of £10.0 billion. Abstracting from Asset Purchase Facility (APF) flows, the larger surplus relative to last year reflected a large £7.4 billion (10.3 per cent) rise in central government (CG) receipts, only some of which was offset by a £1.8 billion rise in CG spending. Borrowing by local authorities was £0.2 billion lower than last year, while borrowing by public corporations was little changed.
3. Borrowing for the year-to-date is now £18.5 billion (46.6 per cent) lower than a year earlier. Meeting our latest EFO forecast for PSNB in 2018-19 as a whole would require a fall of £16.4 billion (39.2 per cent) from the latest estimate of 2017-18 outturn, so our latest forecast would be met if there were a small rise in year-on-year borrowing in February and March. Chart 1.1 shows outturn PSNB on a 12-month rolling basis, relative to our latest full-year forecast for 2018-19.
4. The fall in borrowing so far in 2018-19 has been somewhat greater than that in our October forecast for the full year, thanks primarily to stronger receipts growth. This reflects the effect of stronger earnings growth on PAYE and NICs receipts and, given the payment lags, stronger growth in self-assessment (SA) liabilities in 2017-18.
5. Despite there being only two months of the fiscal year remaining, there is still significant uncertainty over the full-year figure - which itself will inevitably be revised over time:
• Some SA receipts will be collected in February, so the picture for this year is incomplete. HMRC administrative data for early February suggest that some of the strength in January reflected more people paying on time, so the picture for January and February together could be less strong than for January alone.
• Income tax paid on bonuses in the financial and non-financial sectors is concentrated in the final months of the fiscal year. Our October forecast assumed bonuses would rise in line with our broader wages and salaries forecast, but the range of possible outcomes is wide.
• Outturn data for local authority net borrowing will not be available until September 2019, so we will not have the first full picture for overall borrowing for 2018-19 until then at the earliest.
• Other current spending - largely day-to-day spending by CG departments - is also subject to uncertainty in the final months of the year as departments adjust their plans following Supplementary Estimates and following agreements of Budget Exchange and reserve claims with the Treasury.
6. As well as factoring the latest data into our forthcoming March forecast, we will need to judge whether and how they should affect future years. Typically, a higher starting point for receipts would raise our forecast for future years too, but the extent of that effect would depend on many other influences. For instance, ahead of our March forecast we will consider provisional HMRC analysis of SA tax returns to understand the drivers of this month's higher receipts and any implication that has for future years.
Central government receipts
7. January is generally the largest month of the year for tax receipts, with SA payments due at the end of the month, plus cash payments of corporation tax by large firms and VAT receipts relating to the Christmas period. Relative to the same period last year, CG receipts (excluding APF transfers) were up 10.3 per cent in January and 5.4 per cent for the year-to-date. The latter is above our full-year forecast of 4.7 per cent (on a like-for-like basis). Strength in receipts so far in 2018-19 has been particularly evident in PAYE income tax and NICs - up 5.0 per cent year-to-date compared with our full-year forecast of 4.2 per cent. This reflects unexpectedly strong earnings growth and may also indicate that the tax-rich top of the earnings distribution has been outperforming.
8. Total SA receipts in January were up £3.2 billion (15.8 per cent) on a year earlier. SA receipts include income tax, capital gains tax and Class 4 NICs, which are collected together. The breakdown between these tax streams is provisional and subject to change once HMRC have fuller information. Today's HMRC tax receipts publication notes that administrative data indicate the year-on-year rise for the period up to 11 February had declined to £2.6 billion (10.2 per cent). This suggests that timing effects from prompter payments can explain only some of the strength in January SA receipts.
9. Growth in VAT receipts for the year-to-date is in line with our full-year forecast of 5.2 per cent. Other indirect taxes such as fuel, alcohol and tobacco duties are a little weaker than our full-year forecasts. The ONS has announced that from next month's release, it will incorporate additional VAT receipts related to the ‘Mini One Stop Shop' (MOSS) scheme - a way for firms across the EU to pay VAT on the supply of certain digital services. This will boost year-to-date receipts in 2018-19 by around £0.6 billion.
10. Chart 1.2 shows that year-to-date growth in CG receipts is a little stronger than our latest forecast. On a rolling 12-month basis, outturn receipts growth is now slightly above our full-year forecast, reflecting the rise in SA receipts observed this month.
Central government spending
11. Relative to last year, total CG spending (excluding grants to local authorities) was up 3.5 per cent in January and 3.0 per cent for the year-to-date, with the latter just below our October forecast of a 3.1 per cent rise over the full year (on a like-for-like basis). The rise in CG spending in January was driven by an increase in ‘other' CG current and capital spending (reflecting higher departmental spending) and higher net social benefit spending (by £0.8 billion, reflecting higher spending across several benefits).
12. The main driver of weaker spending growth over the first ten months of 2018-19 has been debt interest, which is 9.0 per cent lower than in the same period last year - a somewhat sharper decline than our full-year forecast of a 6.3 per cent fall. Growth in departmental current spending for the year-to-date has been weaker than we forecast for the full year, but these data remain provisional and subject to future revision. There is particular uncertainty over Brexit-related spending in the final months of 2018-19.
13. Chart 1.3 shows that outturn CG spending growth is below our full-year forecast on a year-to-date basis, but in line with our full-year forecast on a rolling 12-month basis. That largely reflects departmental spending, as set out above.
Debt
14. Public sector net debt (PSND) in January 2019 was down 0.8 per cent of GDP from a year earlier, less than the 1.3 per cent of GDP fall we forecast in the EFO for the year to the end of 2018-19. The comparison continues to be distorted by the Bank of England's August 2016 monetary policy measures (which raised PSND by £14.1 billion or 0.7 per cent of GDP in the year to January 2019). This effect will diminish over the final months of 2018-19. Lower borrowing and higher nominal GDP provide the main downward contributions to the fall in the debt-to-GDP ratio. Chart 1.4 shows the outturn debt-to-GDP ratio, relative to our latest forecast for end of 2018-19.
Seethe full report with more graphs at -
https://obr.uk/docs/dlm_uploads/January-2019-Commentary-on-the-Public-Finances.pdf
Our Social Media