Census figures show population of the Highlands on the up but down in Wick and Thurso
23rd December 2013

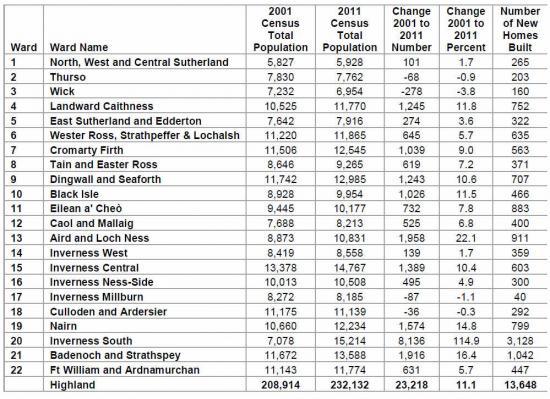
A report for Highland Councillors has highlighted the early results from the 2011 Census which shows that the population of the Highlands has grown over the last decade by 11.1%, with the strongest population growth taking place in the Inverness South and Aird and Loch Ness Wards.
The report also highlights that across the Highlands there is a large number of people in the 55 to 65 age group which means the area should see a steady increase in the number of retired people over the coming years.
Leader of The Highland Council, Councillor Drew Hendry said: The population growth is no surprise as the Highlands is a great place to live and do business in which is why we are prioritising the support and creation of jobs and are working to deliver 5000 new homes by 2017 to attract new people to come to work. At the same time as this optimism for a vibrant and economically robust Highlands, we are aware that a large section of the population is aging which is why we are channelling resources so we can provide the best quality of life possible for those in need of support. Current actions include working with NHS Highland and other agencies in delivering an integrated of health and social care service and the building of two new care homes in Muir of Ord and Tain which began earlier this year as well as funds allocated for refurbishing existing care homes.
�The Census figures do help us to plan for the future and also highlights the strong links between economic growth, new house building and population growth and I believe having an older population can provide opportunities as the vast level of experience older people have can be a very useful resource. Also, with people getting fitter and staying healthier longer, retirees have a lot to give their local communities so I look forward to discussing the 2011 Census results in more detail at a meeting of our Planning, Environment and Development Committee on 8th January.�
Link to committee report
http://www.highland.gov.uk/NR/rdonlyres/B9B9ABDD-7688-4C3E-A849-37E38CEE6395/0/Item5PED314.pdf
The full report is below -
PLANNING, ENVIRONMENT AND DEVELOPMENT COMMITTEE
Report No PED 3/14
8TH JANUARY 2014
POPULATION CHANGE IN HIGHLAND 2001 TO 2011
Report by Director of Planning and Development
Summary
This report is provided for information and looks at the early results from the 2011
Census, giving local information on the number and ages of people living within
Highland. It compares these figures with those from 2001 to show that our population
has �aged�, and that we have a large number of people who are close to retirement
age. Our population has grown by 11.1% with an increase in 18 out of 22 Wards,
and at a local level in 196 out of 292 data zones. Local population growth is strongly
linked to the building of new homes.
1. Background
1.1. Publication of the results from the 2011 Census began in December 2012, and
the most recent published in November 2013 gave the first detailed results for
�census output areas�, the smallest areas for which results are published.
These detailed results have enabled us to prepare the first 2011 Census
profiles and these are available for Wards, Associated School Groups,
Community Councils and Settlement Zones on our website at:
link to census profiles
http://www.highland.gov.uk/yourcouncil/highlandfactsandfigures/census2011.htm
1.2. This report returns to some earlier results and looks at how the age profile of
the Highland population and the total numbers have changed at a local level
(datazones). These changes are summarised in Briefing Note 57 which is
attached at Appendix 1.
2. The Changing Age Structure of our Population
2.1 The first chart in Appendix 1 shows that the shape of the age profile is
unchanged over the last decade and it has �moved� ten years to the right.
Despite the increase in the birth rate since 2002 we have fewer children aged
15 and under, but perhaps the most striking feature is the peak in the 56 to 68
age group. This group will move into retirement during the next decade and
eventually result in an increase in elderly care needs.
2.2 The equivalent dip in the profile in the 30 to 41 age group shows how the
working age population is now biased towards the older age groups, although
the percentage of people in their 20s has been stable.
3 Population Change by Ward
3.1 The Appendix shows the change in the total population in each Ward between
2001 and 2011 together with the number of new homes built during the decade.
As might be expected the largest growth has been in the expansion areas of
Inverness with an increase of 8,136 in Inverness South (115%) and 1,958 in
Aird and Loch Ness (22%). Badenoch & Strathspey, Nairn, Landward
Caithness, Black Isle, Dingwall & Seaforth and Inverness Central have all seen
strong growth around or above the Highland average while growth in Tain &
Easter Ross, Cromarty Firth and the rural west has been more modest. Growth
in Sutherland has been marginal, and four Wards � Wick, Inverness Millburn,
Thurso and Culloden & Ardersier � have all experienced population decline.
3.2 Within Caithness we have seen a general trend of population drift from the
urban areas of Thurso and Wick into rural Caithness and this, in combination
with low economic growth, accounts for the decline in the two towns. Inverness
Millburn is fully developed with little land for new housing while in Culloden &
Ardersier the relatively modest volume of new housing has not kept pace with
the ageing and declining population in the growth areas of the 1980s and 90s.
4 Local Population Change, by Data Zone
4.1 The Appendix shows that that high levels of population growth have occurred
in areas where there has been significant house building, although the growth
in rural areas such as Beauly Rural, Killen & Raddery and Spean Bridge
suggests a change in the types and sizes of families living in these areas.
Zones with the most significant decline tend to be in areas that have seen little
economic growth and / or are fully developed urban areas with little new
housing, where a generally stable population base has aged and household
sizes fallen.
4.2 Urban Areas. The population of urban Inverness and the immediate
surrounding area has increased by 18% and the population of our small towns
(with a population of more than 3,000) has increased by 4%.
At a local level, significant population increase has occurred only where
there has been new house building. Natural population increase through
an excess of births over deaths, and turnover through moving house, are
secondary factors.
Where there has been little recent house building, population decline has
been most marked in areas where there was significant expansion in the
late 1970s through to the 90s: this includes the areas of Inverness such as
Culloden, Kinmylies / Scorguie, Drakies, Holm and Lochardil. In the older expansion areas of the 1950s through to the early 70s such as
Hilton, the population has been stable or seen a modest increase.
The difference between the two generations of expansion area is that
families moving to the more recent areas have seen their children leave
home, the parents have tended to remain, and property turnover has been
inadequate to refresh the population base. In the older areas, the parents
are beginning to age and seek more suitable accommodation, with the
result that the population base is beginning to refresh and bring in new
families.
Later releases of Census results will give more information on
employment, but monitoring of other sources over the last decade
suggests that population growth in urban areas is strongly linked to
economic growth and job creation in the area. The Census was held on
27th
March 2011 and this is probably too early to see the impact of the
recent growth in the energy sector in Caithness and Easter Ross.
4.3 Rural Areas. The population of accessible rural areas within 30 minutes travel
time of Inverness has increased by 14% and remote rural areas more than 30
minutes away have increased by 11%.
The link between economic growth and population growth is less strong in
rural areas. Sutherland has seen little employment growth overall but there
are contrasting population growth rates in (e.g.) north east Sutherland
(decline) and parts of west Sutherland such as Stoer and Scourie (growth).
This may be due the attraction of the west coast as a lifestyle destination,
a trend we can see substantiated in the origins of house buyers.
Remoteness is not an absolute barrier to population growth e.g. the
remote area of Applecross, Shieldaig and Torridon has seen a growth of
6% whereas neighbouring, more accessible, Strathcarron has seen
decline of 5%. Similarly, on Skye, Duirinish has seen growth and
Dunvegan has declined.
Kinlochbervie and Lochinver have each seen a decline in the fishing
industry since the peak years of the 1980s, yet Lochinver has grown by
around 5% and Kinlochbervie has declined by 17%. There may be lessons
we can learn from experiences in these areas about how best to support
remote, rural communities.
In Caithness, the population of Thurso and Wick has declined but there
has been a significant increase in the surrounding rural areas, largely as a
result of new house building helped by the availability of relatively low cost
building plots. These are issues that will be examined in the Caithness &
Sutherland Local Development Plan.
5 Resource Implications
5.1 There are no direct resource implications arising from this report, but the
imminent rise in the number of retired people reinforces the anticipated need for
increased expenditure on care of the elderly in the future.
6 Equalities, Legal, Risk and Climate Change Implications
6.1 There are no equalities, legal, risk or climate change implications for The
Highland Council arising from this factual report.
Recommendation
The Committee is asked to note that the last decade has seen population growth
throughout Highland, and also that:
i. the Census results confirm that our population is ageing and that we are
about to see a significant increase in the number of retired people; and
ii. the strong links between economic growth, new house building and
population growth.
Related Businesses
Related Articles
Exciting Career Opportunities With The Highland Council Now Open For Applications
# 10 December 2025 Career opportunities with The Highland Council The Highland Council is looking to fill a variety of posts relating to civil engineering and flood risk management based in locations across the area. Included are opportunities specifically for civil engineering graduates and technicians, providing the ideal job with career progression for anyone recently qualified and ready for a varied and interesting role.
What the NC500 Research Projects Are Designed to Do - and Why They Matter for the Highlands
As the North Coast 500 approaches its tenth anniversary, it has become one of Scotland's most well-known tourism success stories. The 516-mile loop around the far north of the Highlands has been celebrated internationally, marketed as a world-class road trip, and credited with transforming visitor numbers in some of Scotland’s most remote areas.Help Shape the Future of Thurso
The Highland Council is inviting people that live, work, or study in Thurso, to come along to the public consultation events to have their say. This is an opportunity to help shape the future of Thurso, to gather views and ideas.
Are Scottish Councils Quietly Reversing Outsourcing? A Look at Insourcing, Cuts and the Highland IT Shift
A notable article in the Guardian on 6 December 2025 noted the high sums being paid by London councils outsourcing services to private firms. The article starts with the reduction in council funding by UK government since 2010.Council welcomes Visitor Levy flexibility plan
The Highland Council welcomes moves by the Scottish Government to introduce greater flexibility on how it could design a Visitor Levy Scheme for consultation. The Visitor Levy (Scotland) Act 2024 currently provides local authorities with discretionary powers to implement percentage-based levies following statutory consultation.Highland Council is reaching out for views to shape its next 26/27 budget.
As it looks to set out its forthcoming priorities, the council is seeking involvement from members of the public, including businesses, community groups, parents, and young people. All their opinions are going to be crucial in deciding how Highland Council will take on its budget challenge for 2026-2027.Have your say in Thurso's future £100million investment by attending public consultation events
Thurso is to benefit from £100m investment in education and community facilities and are rolling out the first phase of public consultations on 9 and 10 December 2025. The Highland Council is inviting people that live, work, or study in Thurso, to come along to the public consultation events to have their say; this is an opportunity to help shape the future of Thurso, to gather views and ideas.Finding new owners for empty homes - Scheme launched to help return more empty homes to active use
A new online portal has been launched to bring empty homeowners together with prospective buyers or developers with the aim of facilitating more properties to be used as homes again. Covering the whole of Scotland, this builds on the success of local pilots, referred to as "matchmaker schemes".Consideration for short term let control area in Skye and Raasay
Steps towards introducing a short term let control area have been considered by Highland Council's Isle of Skye and Raasay area committee. On Monday (1 December 2025) the committee heard evidence to justify the grounds for the introduction of a Short Term Let Control Area covering all or part of Skye and Raasay.Workforce North event spotlights Highland economy
EMPLOYERS and educators from across the Highlands have gathered to hear how a new initiative is aiming to transform the region's economy. Workforce North - A Call to Action brought together business leaders and teachers from primary and secondary schools from across the Highland Council area with a wide range of partners geared towards education, learning and skills development at Strathpeffer Pavillion.
