UK House Price Index Scotland: December 2019
19th February 2020
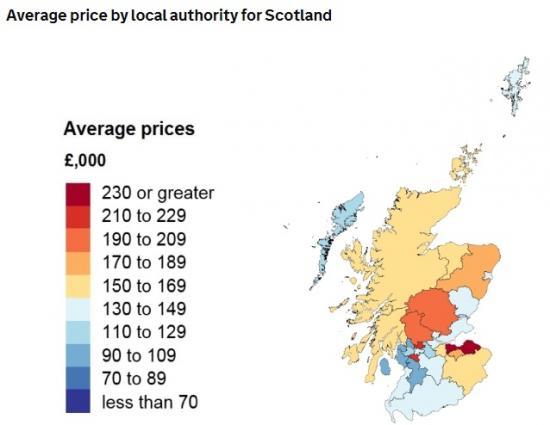
*the average price of a property in Scotland was £151,603.
*the annual price change of a property in Scotland was 2.2%
*the monthly price change of a property in Scotland was -1.5%
*the index figure for Scotland (January 2015 = 100) was 112.3.
Estimates for the most recent months are provisional and are likely to be updated as more data is incorporated into the index. Read the revision policies.
The January 2020 UK HPI will be published at 9.30am on Wednesday 25 March 2020.
Scotland house prices increased by 2.2% in the year to December 2019, down from 2.9% in the year to November 2019. Scotland house prices were growing at the same annual rate as the UK in the year to December 2019. On a non-seasonally adjusted basis average house prices in Scotland fell by 1.5% between November 2019 and December 2019, compared with a fall of 0.9% during the same period a year earlier (November 2018 and December 2018). On a seasonally adjusted basis, average house prices in Scotland fell by 0.04% between November 2019 and December 2019.
Comparing the provisional volume estimate for October 2018 with the provisional estimate for October 2019, volume transactions increased by 2.7% in Scotland. UK volume transactions fell by 0.2% over the same period.
In Scotland, detached houses showed the biggest increase out of all property types, rising by 5.4% in the year to December 2019 to £266,000. The smallest growth of all property types was the average price of flats and maisonettes, down by 0.1% in the year to December 2019 to £108,000.
House prices increased over the last year in 25 out of the 32 local authority areas. The largest growth (not including Na h-Eileanan Siar) was in Inverclyde, where prices increased by 10.1% in the year to December 2019 to £103,000. The biggest fall was recorded in City of Aberdeen where average prices fell over the year by 3.4% to £147,000.
As with other indicators in the housing market, which typically fluctuate from month to month, it is important not to put too much weight on one month's set of house price data.
In Scotland, average prices increased by 2.2% in the year to December 2019 (down from 2.9% in the year to November 2019).
Annual price change by local authority for Scotland
Low numbers of sales transactions in some local authorities, such as Orkney Islands, Na h-Eileanan Siar and Shetland Islands, can lead to volatility in the series.
While we make efforts to account for this volatility, the change in price in these local levels can be influenced by the type and number of properties sold in any given period.
Geographies with low number of sales transactions should be analysed in the context of their longer-term trends rather than focusing on monthly movements.
In December 2019, the most expensive area to purchase a property was City of Edinburgh, where the average cost was £270,000. In contrast, the cheapest area to purchase a property was East Ayrshire, where the average cost was £94,000.
Sales volumes for Scotland
October 2015 - 9,767
October 2016 - 8,503
October 2017 - 9,047
October 2018 - 9,127
October 2019 - 9,250
Sales volumes for Scotland by local authority
Local authorities October 2019 October 2018
Aberdeenshire 304 402
Angus 187 193
Argyll and Bute 205 192
City of Aberdeen 341 313
City of Dundee 217 236
City of Edinburgh 924 923
City of Glasgow 1,077 1,039
Clackmannanshire 88 92
Dumfries and Galloway 245 237
East Ayrshire 213 162
East Dunbartonshire 209 134
East Lothian 206 189
East Renfrewshire 178 133
Falkirk 291 267
Fife 618 593
Highland 418 441
Inverclyde 106 111
Midlothian 172 176
Moray 134 155
Na h-Eileanan Siar 29 26
North Ayrshire 215 210
North Lanarkshire 528 552
Orkney Islands 33 35
Perth and Kinross 301 293
Renfrewshire 363 356
Scottish Borders 182 203
Shetland Islands 28 26
South Ayrshire 241 229
South Lanarkshire 646 651
Stirling 173 176
West Dunbartonshire 126 120
West Lothian 252 262
Scotland 9,250 9,127
Details published on 19 February 2020 by HM Land Registry.
The full release shows details for England and Wales and other more detailed charts with explanations on the development of the statistics.
See https://www.gov.uk/government/organisations/land-registry