Personal And Economic Well-being In Great Britain: January 2021
21st January 2021
From the Office for National Statistics published 21 January 2021.
Estimates looking across multiple sources for personal and economic well-being to understand the impact of the coronavirus (COVID-19) pandemic on people and households in Great Britain. Covers the period from March 2020 to December 2020.
Main points
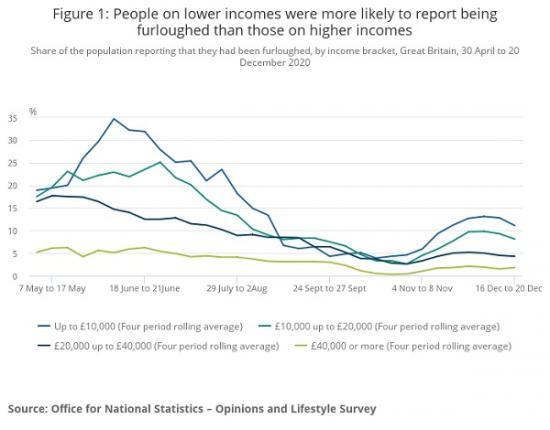
The labour market shocks associated with the coronavirus (COVID-19) pandemic have been felt more by young people and the lowest paid; people aged under 30 years and those with household incomes under £10,000 were around 35% and 60%, respectively, more likely to be furloughed than the general population.
Of those who have not been able to work (either because of being on furlough or for another reason), over half (52%) of people in the top income quintile continued to be paid in full, while this was the case for only 28% of those in the lowest income quintile.
People with a job or seeking work were more likely to have decreased income during the pandemic, and particularly the poorest 20%, while others such as retired people out of the labour market were more protected.
Throughout the pandemic, employed parents were almost twice as likely to report a reduction in income than the general employed population, although this gap gradually narrowed throughout 2020 as schools reopened.
Self-employed people were more likely to report reduced working hours and reduced income, even if they had received support from the Self-Employment Income Support Scheme (SEISS).
By December 2020, nearly 9 million people had to borrow more money because of the coronavirus pandemic; the proportion borrowing £1,000 or more also increased from 35% to 45% since June 2020.
Impacts to household spending have been felt differently across groups, with parents less able to afford either a holiday or an unexpected but necessary expense than non-parents; they were also roughly 50% more likely to have difficulty meeting their usual expenses.
Work and income
In 2020, the coronavirus (COVID-19) impacted people across all sections of society.
The number of people reporting that they had been furloughed steadily reduced over the summer months, but this proportion started to increase again in November 2020, to coincide with further restrictions across certain parts of the country. Young people and those on the lowest incomes were most likely to be impacted in this second phase of restrictions, as they were in the first lockdown, with a six-fold increase in those aged under 30 years reporting that they had been furloughed. This increased from 2.1% for the five days to 1 November 2020 to 12.3% a week later.
Those on the lowest incomes were also more likely to be furloughed during 2020. Between 11 and 15 November 2020, when restrictions were tightened in some areas of the country, 17% of people with a household income less than £10,000 reported that they had been furloughed. In comparison, only 2.7% of people with a household income of more than £40,000 reported this.
Similarly, those in high-income groups reported that they were more likely to be able to work from home, with 55.1% of people with income over £20,000 able to work from home compared with 19.1% of people with income less than £20,000.
The Coronavirus Job Retention Scheme allowed employers to "top-up" the earnings of those who were on furlough, and data from the Survey of Living Conditions suggests that this was less likely to happen for those on lower incomes.
Of those whose work was affected by the coronavirus at any point in the pandemic, people who were in the bottom quintile of the income distribution (as measured by their income in the same period of the previous year) were much more likely to be paid in part (60.9%) than in full (27.8%). By contrast, over half (52%) of people in the top quintile of the income distribution were paid in full.
For those working or unemployed (classed as economically active), those in poorer households were more likely to report reduced income, as well as being more likely to be furloughed and paid in part if this were to occur. The proportion of economically active people who reported reduced income was 43.8% among those in the lowest income quintile, which compares with only 30.4% of those in the top income quintile.
However, in the economically inactive population, the proportion of people reporting reduced income was much smaller at approximately 13% across all income quintiles. This group tends to receive most of their income from pensions, property income (for example, rental income) or benefits, and are therefore less likely to be impacted by disruptions to the labour market. Even when constrained to people of working age, the proportion reporting reduced income was equal across the quintiles.
There were substantial differences across age groups in the proportion of employed people reporting lower income. Among those aged 16 to 30 years, 12.3% with a job reported reduced income over the period 16 to 20 December 2020, with the figure much higher for those aged 30 to 59 years at 17.9%, while only 6.5% of those aged over 60 years reported this. These differences across age groups have remained stable since the pandemic began.
In addition, a greater proportion of employed parents with children in the home also reported reduced income throughout 2020. At the start of the pandemic, parents in work were more than twice as likely to report reduced income than non-parents in work (31.7% and 15.1% respectively). This decreased over the course of the pandemic, with only 17.1% of parents reporting reduced income in the five days to 20 December 2020, compared with 12% of non-parents reporting this over the same period.
Self-employed people were more likely to report reduced hours and income compared with the employee population. In December 2020, the self-employed were around 5.5 times more likely to report reduced hours than employees, up from the first lockdown where they were between two and four times more likely.
Almost one-quarter (24.2%) of self-employed people had received support from the Self-Employment Income Support Scheme (SEISS) up to October 2020. In comparison, 17.6% of employees were receiving or had at some point received support from the Coronavirus Job Retention Scheme (CJRS).
Savings, borrowing and affordability
Over the course of 2020, there was an increase in the number of people borrowing more money, and in larger amounts. This coincided with a decrease in people being able to save for the year ahead, with lower income groups, self-employed and people who rent accommodation most affected.
At the end of June 2020, 10.8% of adults reported borrowing money, rising to 17.4% in December 2020. Of those, the proportion borrowing more than £1,000 increased from 34.7% to 45.1% in the same period.
Self-employed people were more likely to borrow more than £1,000 than employees in early December 2020 (60.9% versus 49.4% of those who borrowed), and there was a large increase in the proportion of disabled individuals borrowing more than £1,000 (rising from 12.8% to 36.2% of all that borrowed since June).
As the pandemic progressed, increasing proportions of people reported that they would not be able to save for the year ahead. At the end of March 2020, 31.6% of people said they would be unable to save, increasing to 38.4% in mid-December 2020.
Groups that found it harder to save included those on incomes below £20,000, self-employed individuals and people living in rented accommodation (Table 1). Conversely, the under-30 age group consistently reported being more likely to be able to save than other age groups.
Despite the need to borrow more and save less, the proportion of individuals who were unable to afford an unexpected but necessary expense of £850 remained stable throughout the pandemic period, with a weekly average of 31% from 9 April to 20 December 2020.
However, some groups found it easier to afford an unexpected expense than others. From April to October 2020, individuals aged under 30 years were less likely to report being able to afford an unexpected expense (62.9%) than individuals aged 30 to 59 years (72.5%) or those aged 60 years and over (80.7%). Similarly, parents were less able to afford an unexpected expense (62.8%) than non-parents (79.7%).
These differences could also be observed when respondents were asked if their household could afford a week's annual holiday away from home, with younger individuals and parents (70.2% and 71.9% respectively) less able to afford a holiday than older individuals and non-parents (81.7% and 82.1% respectively).
The ease with which individuals have been able to pay their usual expenses has also differed over the course of the pandemic. From April to October 2020, 27.3% of people had some degree of difficulty paying their usual expenses.
The most influenced groups of the population included individuals aged under 30 years who were more likely to report having difficulty meeting their expenses (34%) compared with those aged 30 to 59 years (26.5%) or aged 60 years and over (24.3%). Parents were also more likely to have difficulty meeting their expenses (34.8%) than non-parents (20.7%).
Personal well-being and expectations for the future
Since the initial lockdown at the end of March 2020, levels of both anxiety and happiness have seen substantial and significant improvement. Looking at the week ending 30 March, the mean rating for anxiety was 5.18 out of 10. By the period of 7 to 11 October this had fallen by 30.5% to 3.97. The improvement in happiness was smaller but still significant, with the mean average increasing by 8.9% from 6.36 in the week ending 30 March to 6.98 in the same period of 7 to 11 October. Expectations about when life would return to normal fluctuated as the pandemic progressed, with more people hopeful that life would return to normal sooner rather than later at the end of the year, and more people increasingly optimistic about their own household finances.
Despite the improvement to levels of happiness and anxiety, they remain significantly worsened compared with pre-pandemic levels. Similarly, mean ratings of life satisfaction and feeling that things done in life are worthwhile remain subdued, particularly for those who reported feeling lonely always or often. For this group, the mean rating of life satisfaction was 3.83 out of 10 in the period of 16 to 20 December 2020, which was 46.5% lower than the overall UK average of 7.16 for the same period.
Previous analysis identified that in the early stages of lockdown, anxiety was significantly higher for women than it was for men. However, in the subsequent weeks, the gap between the sexes narrowed, such that by the week ending 10 May, the gap was no longer significant. For context, prior to lockdown, anxiety was usually higher for women than men. While men and women reported similar levels of life satisfaction early in the pandemic, in the period of 28 October to 1 November, women reported significantly lower life satisfaction than men. The mean rating of 6.34 for women was 5.8% lower than the mean of 6.71 for men. Average levels of personal well-being across different demographic groups are shown in our associated datasets.
On 4 February 2021, quarterly estimates of personal well-being will be published using data from the Annual Population Survey (APS). There will be an article published on the same day that considers the impact that the pandemic has had on data collection, to what extent this has influenced estimates of personal well-being and reviews the comparability between estimates from the OPN and the APS.
In terms of future expectations, fewer people thought that life would either never return to normal, or would take more than a year to do so, from 44.4% of the population for the five days to 25 October 2020 to 26.7% for 16 to 20 December 2020.
Although most people continue to believe that the general economic situation will get worse, this proportion has also fallen, from 85.3% at the start of November 2020 to 68.4% in early December 2020. In addition, people are becoming more optimistic when asked on the prospects for their personal household financial situation. The number of people who expect the financial position of their household to get better over the next 12 months increased from 11.0% in April 2020 to 21.5% at the end of December 2020.
Optimism levels were different depending on an individuals' employment status and age group. For example, self-employed people were 37.5% more likely to expect their household financial situation to get worse, compared with employees, throughout the pandemic. Despite being more likely to have been furloughed recently, those aged under 30 years were the least likely to expect their household finances to get worse throughout the pandemic.
Note
The above is a selection of the main points from the report. To see more data links and graphs with notes go HERE