Coronavirus and the latest indicators for the UK economy and society: 21 January 2021
21st January 2021
Published today (21 January 2021) by the Office for National Statistics.
Early experimental data on the impact of the coronavirus (COVID-19) on the UK economy and society. These faster indicators are created using rapid response surveys, novel data sources and experimental methods.
Main points
Today we are launching an experimental faster indicator for estimating UK spending using debit and credit cards. Clearing House Automated Payment System (CHAPS) provides an indicator of UK companies' sales. See Section 3
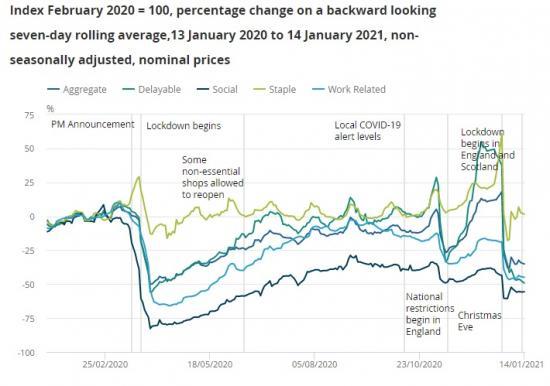
According to the Bank of England's CHAPS data, aggregate UK debit and credit card purchases were 35% below their February 2020 average in the week to 14 January 2021. See Section 3
According to the Business Impact of Coronavirus (COVID-19) Survey, over a quarter (26%) of UK businesses currently trading said that turnover had decreased by more than 20% compared with what is normally expected for this time of year. See Section 4
According to the latest Opinions and Lifestyle Survey, in the week ending 17 January 2021, the proportion of working adults in Great Britain who travelled to work in the last seven days stayed the same as the previous period at 48%. See Section 5
According to Springboard, in the week ending 17 January 2021, overall retail footfall in the UK is at 33% when compared with the same week a year ago, the lowest level since the week ending 7 June 2020. See Section 6
According to exactEarth seasonally adjusted shipping data, the seven-day average of the number of daily cargo ship visits has increased recently but has remained low at an average of 88 visits. See Section 7
Overall prices of items in the food and drink basket were unchanged in the week ending 17 January 2021. See Section 8
Figure 1: In the week to 14 January 2021, aggregate CHAPS debit and credit card purchases were 35% below their February 2020 average.
According to Adzuna, between 8 and 15 January 2021, the volume of online job adverts decreased across all UK regions, except for Yorkshire and The Humber. See Section 9
According to the Department for Transport (DfT), on Monday 18 January 2021 the volume of all motor vehicle traffic remained unchanged when compared with the Monday of the previous week. See Section 10
UK spending on debit and credit cards
Today we are launching an experimental faster indicator for estimating UK spending on debit and credit cards, which is an indicator of UK companies' sales. The value of Clearing House Automated Payment System (CHAPS) payments received by large UK companies from their credit and debit card processors, known as "merchant acquirers", provides an indicator of UK companies' transactions made by customers, both via physical and online platforms. More information on the indicator is provided in the accompanying methodology article. Companies are allocated to one of four categories based on their primary business:
"staples" refers to companies that sell essential goods that households need to purchase, such as food and utilities
"work-related" refers to companies providing public transport or selling petrol
"delayable" refers to companies selling goods whose purchase could be delayed, such as clothing or furnishings
"social" refers to spending on travel and eating out
Scope of CHAPS
Users should note that, where used, the term "retail" in CHAPS is not consistent with that used in the Office for National Statistics (ONS) Retail sales figures. ONS's figures provide monthly estimates on what consumers are buying, and how much they are spending on items in stores and online. Retail in the CHAPS data uses a broader definition adding to the mix expenditure on social activities, such as sporting events, concerts, a meal or drinks in a pub or restaurant, haircuts, beauty treatments and train fares.
CHAPS may also capture some corporate spending as well as consumer expenditure.
Spending fell in the week following Christmas, and has remained relatively low for "work-related", "social" and "delayable" expenditure. This is expected, coinciding with the extension of Tier 4 restrictions on Boxing Day, and the start of national lockdowns in the UK on 5 January 2021. In the week to 14 January 2021, aggregate CHAPS purchases were 35% below their February 2020 average with delayable expenditure seeing further decline from the previous week to 49% below their February 2020 average.
Across all UK industries, in Wave 22:
66% of businesses had been trading for more than the last two weeks (broadly unchanged from 68% in Wave 21)
4% of businesses had started trading within the last two weeks after a pause in trading (broadly unchanged from 3% in Wave 21)
4% of businesses had paused trading but intend to restart in the next two weeks (a decrease from 9% in Wave 21)
23% of businesses had paused trading and do not intend to restart in the next two weeks (an increase from 18% in Wave 21)
3% of businesses had permanently ceased trading (broadly unchanged from 2% in Wave 21)
Travelling to work
In the week ending 17 January 2021, the proportion of working adults in Great Britain who:
travelled to work in the last seven days (both exclusively and in combination with working from home) stayed the same as the previous period (Wave 40) at 48%
worked exclusively from home in the last seven days stayed broadly the same at 35%
neither travelled to work nor worked from home in the last seven days stayed broadly the same at 16%
Shopping
The proportion of adults who shopped for things other than food and medicine in the last seven days stayed broadly the same at 5%; this continued low level coincides with lockdowns in all countries of the UK. The proportion of adults that shopped for food and medicine in the last seven days increased by 3 percentage points to 75%.
Footfall
These figures are provided by Springboard, a provider of data on customer activity. They measure the volume of footfall compared with the same day the previous year at the overall level and across the categories of high streets, retail parks and shopping centres. For example, Sunday 10 January 2021 was compared with Sunday 12 January 2020.
According to Springboard, in the week ending 17 January 2021, overall retail footfall in the UK fell by 2 percentage points to 33% of the level seen in the same week of the previous year, the lowest level since the week ending 7 June 2020.
Footfall fell across all retail locations compared with the previous week. High streets decreased the most, by 3 percentage points on the week to 25% of the volume seen in the same week a year ago, shopping centres footfall fell by 2 percentage points to 26%, and retail parks footfall fell by 1 percentage point to 56%.
Online price change in the food and drink basket
A timely indication of weekly online price change for a selection of food and drink products from several large UK retailers has been developed, covering the period 1 June 2020 to 17 January 2021. Details of the methodology used for these indicators can be found in Online price changes methodology. This analysis is experimental and should not be compared with our regular consumer price statistics.
The data time series, weekly growth rates, and contributions to the weekly change for all individual food and drink items, along with sample sizes, are published in a dataset alongside this release.
The overall prices of items in the online food and drink basket were unchanged between the week ending 10 January 2021 and the week ending 17 January 2021, with some product categories experiencing price falls, while others experienced offsetting price rises.
Job Adverts
According to Adzuna, in the latest week ending 15 January 2021, the volume of UK online job adverts decreased by 4 percentage points from the previous week to 68% of the level seen in the same week last year.
Excluding the "unknown" category, online job adverts decreased in 26 out of 28 categories from the previous week; "Healthcare and social care" and "Legal" saw an increase of 7 percentage points and 2 percentage points, respectively. "Manufacturing" and “Transport, logistics and warehouse” each saw the largest decline, down by 15 percentage points from the previous week, to 89% and 86% of the volume seen last year. This week “Catering and Hospitality” has the lowest volume of online job adverts, at 25% of the level seen last year.
In the latest week, job adverts decreased across all UK countries and English regions, except for Yorkshire and The Humber, which broadly stabilised at 77% of its volume when compared with the same week of last year. London remains the region with the lowest volume of job adverts, at 55% of the volume seen in the same week of last year.
The overall decrease in online job adverts coincides with the continuation of various lockdown restrictions across the UK, announced in late December 2020 and early January 2021, ordering the public to stay at home except for essential purposes.
Note
Read the full report with more data, graphs and links at
https://www.ons.gov.uk/peoplepopulationandcommunity/healthandsocialcare/conditionsanddiseases/bulletins/coronavirustheukeconomyandsocietyfasterindicators/21january2021