Coronavirus COVID-19 state of the epidemic in Scotland - 19 February 2021
20th February 2021
STATE OF THE EPIDEMIC IN SCOTLAND, 19 FEBRUARY 2021
This report summarises the data up to and including the 18 February 2021 on COVID19 in Scotland.
Cases and incidence
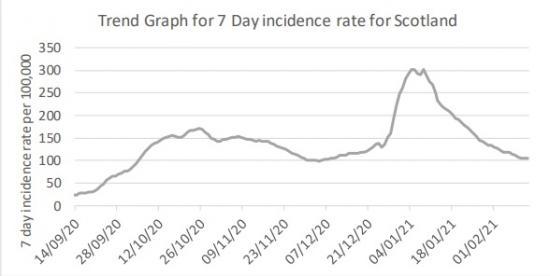
Over the last month we have seen the impact of stay at home measures in reducing the level of SARS-CoV-2 in Scotland, however in the last week there has been a levelling off in the average number of cases reported daily. An average of 826 cases
were reported per day in the 7 days to 18 February. This is about the same level as was reported a week ago, and around a third of the daily cases reported at the peak of 2,323 average daily cases reported in the week to 7 January. Our current position is 101 weekly cases per 100,0002 in the week to 15 February. This compares to 302 weekly cases per 100,000 on 8 January and is now similar to the weekly case rate observed at the beginning of December (see Figure 1). Test positivity has decreased
since stay at home measures were introduced, and is now at 5.4% on average over the past week (to 15 February).
East Ayrshire currently has the highest case rates in Scotland with over 300 weekly cases being reported per 100,000 in the week to 15 February. This is an increase of 96% from 162 to 318 weekly cases per 100,000 in the week 8 - 15 February. Much of this increase can be attributed to an ongoing outbreak in Kilmarnock prison, where 252 cases have been reported to 18 February5. Clackmannanshire and West Dunbartonshire, currently have over 200 weekly cases per 100,000.
Clackmannanshire has seen a 4% increase in weekly cases (from 219 to 229) per 100,00 over 8 - 15 February, while West Dunbartonshire has seen a 22% increase in weekly cases (from 175 to 215) per 100,000 population in the same period. East Ayrshire currently has the highest positivity rate in Scotland, which has been
increasing in the last week and currently sits at 12.6% as of 15 February. Other Local Authorities that have recorded an increase in cases per 100,000 over 8 - 15 February were Fife (+5%, from 58 to 61), Orkney (+600%, from 4 to 31), Renfrewshire (+22%,
from 142 to 174) and West Lothian (+42%, from 123 to 175). Case rates have fallen or remained stable in most other parts of Scotland. Over the past week the incidence rate per 100,000 has gone down to 0 in Shetland.
Levels of infection and what modelling tells us about the epidemic
Not everyone who has the virus will be tested as many people do not realise they have COVID or have mild symptoms and do not come forward. Latest modelled estimates suggest there are currently anywhere between 0 and 5,200 people infected each day.
This means that as of 10 February there were between 0 and 96 new daily infections per 100,000 people. In a UK context, the level of infection from the ONS survey in Scotland (0.55% people currently testing positive for Covid on 31 Jan - 06 Feb ) is
below England (0.88%), Wales (0.81%) and Northern Ireland (0.97%)7. Average daily deaths in Scotland (0.7 per 100,000 in the week to 17 February) are above Northern Ireland (0.4 per 100,000) and Wales (0.6 per 100,000), but lower than in England (0.9
per 100,000).
The latest R value for Scotland (published on 18 February) has remained the same as the previous two weeks and was between 0.7 and 0.9 (Figure 2), with a growth rate of between -6% and -2%8.
Read the full report with graphs and charts HERE 5 pages