Regional Aggregation And Economic Performance: The Relative Position Of Scotland
20th February 2021
A Fraser of Allender Article published 19 February 2021.
Back in 2019, Boris Johnson promised to "unite and level up" different regions of the UK. In particular, Johnson promised to boost economic prosperity in "left-behind" regions, outside London and the South East.
Given that the UK has one of the highest levels of regional income inequality across developed countries, a leveling up agenda could support inclusive growth.
But where does Scotland fit into this picture?
At first glance, Scotland has income levels close to the UK average. However, when looking at smaller regions within Scotland, income levels vary widely.
This becomes clear when looking at Gross Disposable Household Income (GDHI) data, published by the Office for National Statistics (ONS). GDHI per head is a good proxy for material welfare, as it measures individual disposable income, after taxes and benefits. It is available for three levels of regional aggregation.
NUTS 1 level
The broadest aggregation is defined by ‘NUTS 1' regions. This includes Wales, Northern Ireland, and nine regions in England. Among those, London has the highest GDHI per capita, emphasising its longstanding position as the UK's economic powerhouse. In contrast, North East England as well as Northern Ireland and Wales consistently lag behind. Incomes in these regions are more than 40% lower than in London, making them possible candidates for "levelling up" policies.
At around £20,000 GDHI per head in 2018, Scotland takes up a position in the midfield, close to the national average of £21,000. However, at 2.2%, Scotland had the second lowest average annual growth rate in GDHI per head over the 2008 - 2018 period. Chart 1.
A different picture at NUTS 2 level
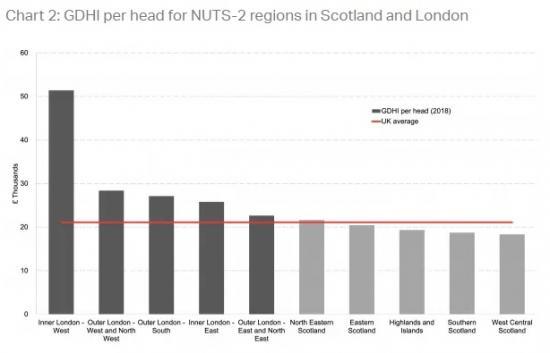
Looking at NUTS 1 level data in isolation can mask important economic differences within regions. This becomes clear, when looking at slightly more disaggregated regions than NUTS 1 areas, defined by NUTS 2 regions.
At £51,000 in 2018, ‘Inner London - West' has the highest income level across all UK NUTS 2 regions. In fact, average incomes in the rest of London are much closer to the richest areas in Scotland than to this outlier. For instance, the income difference between some areas of outer London and eastern Scotland are only around £1,000 per year - while those same areas have incomes that are over £20,000 lower than those in the richest part of London. Chart 2.
But it is not all roses for Scotland, the poorest areas of Scotland have incomes that are much closer to North East England, one of the UK's poorest regions, than to the richest parts of Scotland, in the east coast. Chart 3.
Authors
Anton Knoche
Anton spends half of his time working as a Research Assistant at the Fraser of Allander Institute. He dedicates the other half of his time towards studying for an M.Sc. in Economics at the University of Edinburgh. Anton holds a B.Sc. in Economics from Maastricht University in the Netherlands. In the past, he worked on research projects related to environmental economics and computational macroeconomics.
Adam McGeoch
Adam is a Knowledge Exchange Associate at the Fraser of Allander Institute. They joined the FAI in 2018 and has been involved in various projects, particularly those involving IO modelling. Adam has an honours degree and masters in economics.
Read the full report with al the charts and graphs etc HERE
Note
NUTS - NOMENCLATURE OF TERRITORIAL UNITS FOR STATISTICS
Read about the background to NUTS HERE