
Inflation Rate Hits Highest Ever Recorded
15th September 2021
The Office for National Statistics today reported the highest rate for inflation since records began in the present form.
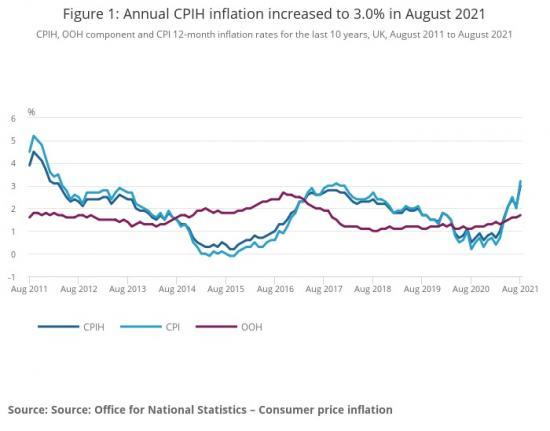
The Consumer Prices Index including owner occupiers' housing costs (CPIH) rose by 3.0% in the 12 months to August 2021, up from 2.1% in the 12 months to July.
The increase of 0.9 percentage points is the largest increase ever recorded in the CPIH National Statistic 12-month inflation rate series, which began in January 2006; however, this is likely to be a temporary change.
The largest upward contribution to change is a base effect, because, in part, of discounted restaurant and cafe prices in August 2020 resulting from the government's Eat Out to Help Out scheme and, to a lesser extent, reductions in Value Added Tax (VAT) across the same sector.
The largest upward contribution to the August 2021 CPIH 12-month inflation rate came from transport (0.87 percentage points) with further large upward contributions from restaurants and hotels (0.65 percentage points), housing and household services (0.65 percentage points), and recreation and culture (0.28 percentage points).
CPIH increased by 0.6% on the month in August 2021, compared with a fall of 0.3% in August 2020.
Restaurants and hotels, recreation and culture, and food and non-alcoholic beverages made the largest upward contributions to the change in the CPIH 12-month inflation rate between July and August 2021.
The Consumer Prices Index (CPI) rose by 3.2% in the 12 months to August 2021, up from 2.0% in July: the increase of 1.2 percentage points is the largest ever recorded increase in the CPI National Statistic 12-month inflation rate series, which began in January 1997; this is likely to be a temporary change.
On a monthly basis, CPI increased 0.7% in August 2021, compared with a fall of 0.4% in August 2020.
Football admissions became available in August 2021, meaning that there are no more CPIH items identified as unavailable because of lockdown restrictions.
The Consumer Prices Index including owner occupiers' housing costs (CPIH) rose by 3.0% in the 12 months to August 2021, up from 2.1% to July. This is the largest ever recorded change in the CPIH 12-month inflation rate1. Previously the largest change was recorded in December 2008, when the 12-month rate decreased 0.8 percentage points to 3.0%. Inflation rates at this time are influenced by the effects of the coronavirus (COVID-19) lockdowns in 2020. The Office for National Statistics' (ONS) blog Beware Base Effects describes how relatively low prices for some items during and after that period influence current inflation rates. In particular, in August 2020 many prices in restaurants and cafes were discounted because of the government's Eat Out to Help Out (EOHO) scheme, which offered customers half-price food and drink to eat or drink in (up to the value of £10) between Mondays and Wednesdays. Because EOHO was a short-term scheme, the upward shift in the August 2021 12-month inflation rate is likely to be temporary.
The Consumer Prices Index (CPI) rose by 3.2% in the 12 months to August 2021, up from 2.0% to July. This is also the largest ever increase in the CPI 12-month inflation rate2. The large change in the level of the index is likely to be a temporary effect.
On a monthly basis, CPIH rose by 0.6% in August 2021, where price rises in transport, recreation and culture, food and non-alcoholic beverages, and restaurants and hotels contributed to the monthly rate. While there was a fall of 0.3% in the same month the previous year, the main downward contribution to last year's monthly rate came from restaurants and cafes, reflecting the impact of the EOHO scheme. However, this was the only instance of a negative 1-month inflation rate for August in the series history. The three-year average CPIH 1-month inflation rate for August 2017, 2018 and 2019 was 0.5%. More information on contributions to change is provided in section 4.
In August 2021 the CPI rose by 0.7% from the previous month, compared with a fall of 0.4% in the same month the previous year.
Given that the owner occupiers' housing costs (OOH) component accounts for around 19% of the CPIH, it is the main driver for differences between the CPIH and CPI inflation rates.
Transport
The contribution from transport has shown more variation than any other group over the last two years. It has ranged from a downward contribution of 0.20 percentage points in May 2020 during the first coronavirus (COVID-19) lockdown to an upward contribution of 0.87 percentage points in August 2021. This is the largest upward contribution from any division this month and the largest from transport since November 2011.
Within transport, the movements have mainly been caused by changes in the price of motor fuels. Motor fuels made a downward contribution to the 12-month rate between March 2020 and February 2021, before the contribution turned positive in March 2021 and subsequently increased to 0.41 percentage points in June 2021. It has since eased in July and August, with a contribution of 0.37 percentage points in August.
Average petrol prices stood at 134.6 pence per litre in August 2021, compared with 113.1 pence per litre a year earlier. The August 2021 price is the highest recorded since September 2013. In comparison, in August 2020, some areas of the UK saw a relaxation of movement restrictions and petrol prices were therefore recovering after a period of reduced demand.
The contribution from second-hand cars has also changed significantly since the beginning of 2020, rising from a downward effect of 0.07 percentage points in January 2020 to an upward pull of 0.15 percentage points in October. With the onset of the coronavirus pandemic, there were reports of increased demand as people sought alternatives to public transport. From October 2020, the contribution to the 12-month rate gradually fell back to 0.01 percentage points in April 2021 before rising again to 0.22 percentage points in August 2021, the largest contribution from second-hand cars since March 2010. Used car prices increased 4.9% on the month to August 2021 and have increased cumulatively by 18.4% since April 2021. By comparison, in 2020, used car prices grew 1.4% on the month to August and cumulatively by 0.3% between April and August. It should also be noted, however, that in April 2021, prices were lower than in April 2020.
These latest movements come amidst reports of increased demand as dealers opened following the latest national lockdown, together with a global semiconductor shortage affecting the production of new cars and resulting in consumers turning to the used car market. Additionally, there are reportedly concerns in the trade about the supply of second-hand cars because of a variety of factors. These include fewer one-year-old cars coming to the market now because of a fall in new car registrations last year, and the extensions of lease contracts and fewer part exchanges caused again by delays in new-car supply. The latest Prices Economic Analysis compares the growth in second-hand car prices in the UK with the Euro area and United States.
There were also large upward contributions from new cars (0.06 percentage points), maintenance and repairs (0.06 percentage points), other services in respect of personal transport equipment (0.06 percentage points), and passenger transport by air (0.04 percentage points). This is the first time that air fares have materially contributed to the CPIH 12-month inflation rate as an available item since December 2020.
Restaurants and hotels
The contribution from restaurants and hotels increased to 0.65 percentage points in August 2021. This is the largest contribution that this division has ever made to the CPIH annual rate.
This upward contribution was largely driven by widespread discounting of restaurant and cafe prices in the previous year. The government's Eat Out to Help Out (EOHO) scheme ran in August 2020 and offered diners a 50% discount (up to a maximum of £10 per diner) on food and non-alcoholic drinks to eat or drink in every Monday, Tuesday and Wednesday at participating establishments. At the same time, a reduction in Value Added Tax (VAT) from 20% to 5% for the hospitality sector also contributed to a fall in prices. The reduced VAT rate is still in operation and is due to be increased for the hospitality sector from 1 October 2021 to 12.5%.
In August 2020, the restaurants and hotels division made a downward contribution of 0.27 percentage points reflecting a negative divisional 12-month inflation rate of 2.8%. This was the first time that the 12-month rate had been negative in the National Statistic series since January 2006.
Supplementary analysis in our quarterly prices economic analysis suggested that the EOHO scheme's offer prices may have reduced the measured rate of CPIH inflation in August 2020 by 0.3 percentage points to 0.5%. Applying that analysis to this year's data suggests that the 12-month inflation rate for restaurants and hotels would have reduced from 8.6% to 5.2% after removing EOHO discounts. The EOHO scheme contributed 0.3 percentage points of the 0.65 percentage point contribution from restaurants and hotels in August this year. Therefore, had the EOHO scheme not taken place last year, the CPIH 12-month inflation rate for August 2021 would have been 2.7% (Figure 4). Similarly, the effect on the CPI would have been to reduce the 12-month inflation rate for August 2021 by 0.4 percentage points. Note that this analysis does not consider the effects of the VAT reduction in August 2020, since the reduced rate of VAT is still in place and the effect of the reduction was much smaller than the EOHO effect.
Housing and household services
The contribution from housing and household services rose marginally from July to 0.65 percentage points in August 2021. The main upward pressures come from owner occupiers' housing costs and rents, which contributed 0.3 percentage points and 0.1 percentage points respectively. There was a negligible change from other housing and household services components, whose contributions remain significantly above those from April 2020 to March 2021. Reductions to household utility prices in April 2020 saw the group's contribution to the CPIH headline rate fall to 0.16 percentage points but this fall was reversed in April 2021 with rises in gas and electricity prices.
Recreation and culture
During the period from April 2020 to January 2021, the largest contribution to the 12-month rate came from recreation and culture, reaching 0.35 percentage points in August 2020 then again in December 2020 and January 2021. This has since eased back somewhat and currently contributes 0.28 percentage points to the CPIH annual rate. Contributions from this category are subject to short-term fluctuations as a result of price movements for items such as computer games and, historically, they have also been influenced by the imputation of price indices for some items that have been unavailable because of the coronavirus pandemic; examples include package holidays and various recreational and cultural services.
Restaurants and hotels
The largest contribution to the change in the CPIH 12-month inflation rate comes from restaurants and hotels which increased the August 2021 12-month rate by 0.55 percentage points relative to July 2021. This effect is predominantly caused by large price falls a year ago in August 2020 compared with a modest rise in prices in 2021. These price falls were seen in the catering services group and were largely driven by discounting under the Eat Out to Help Out (EOHO) scheme.
Last year, catering services prices fell by 5.7% on the month to August, compared with a rise of 0.3% in the same month a year earlier. This translated to a downward contribution to the change in last August's CPIH 12-month inflation rate of 0.49 percentage points. Overall, in August 2020, the all-items CPIH 12-month inflation rate fell 0.6 percentage points to 0.5%.
Analysis suggests that removing EOHO discounts would have slowed the fall in last August's 1-month growth rate for catering services to 2.0%. In August 2021, catering services would therefore have contributed 0.18 percentage points to the change in the overall CPIH 12-month inflation rate, 0.3 percentage points less than the official contribution to change from catering services, which is affected by discounted EOHO prices. As in section 3, this analysis does not include the reduction in Value Added Tax (VAT), which also came into effect in August 2020.
The remainder of the contribution to change from restaurants and hotels came from accommodation services, which increased the 12-month rate by 0.07 percentage points. This is mainly because of prices for hotels and similar accommodation services, which rose faster in August 2021 than they did in the same month a year ago.
Recreation and culture
Recreation and culture contributed 0.2 percentage points to the change in the CPIH 12-month inflation rate. Of this contribution, 0.12 percentage points came from games, toys and hobbies. This was largely driven by computer game prices which, with the exception of downloads, fell between July and August 2020, but increased between the same two months in 2021. Prices for these products could have been influenced by the coronavirus restrictions changing the timing of demand, though it is equally likely to be the result of the CDs and games in the bestseller charts used when collecting price quotes.
Food and non-alcoholic beverages
Food and non-alcoholic beverages also made a large contribution to the change in the CPIH annual rate, increasing it by 0.09 percentage points to August 2021. This was mainly because of an accumulation of small predominantly upward contributions to change across the food basket. Across the division as a whole, prices increased by more between July and August 2021 than they did between the same two months a year ago. However, at a lower level, the most notable upward contributions to change occurred because prices fell last year, compared with either a smaller fall in price this year or a small price rise. The most notable upward movements were in bread and cereals (0.03 percentage points), oils and fats (0.02 percentage points), and coffee, tea and cocoa (0.02 percentage points).
There are anecdotal reports that shortages of supply chain staff and increased shipping costs, coupled with demand increases following the lifting of national lockdowns are driving food price inflation. The average effect across food and non-alcoholic beverages points to an increase of 1.1% on the month to August 2021, the highest rate of monthly growth in August for this division since August 2008 when food and non-alcoholic beverages prices increased by 1.3%. However, it should also be noted that the lower level story for different classes is more complex.
Read the full Report HERE
Our Social Media