Carbon Dioxide Emissions And Woodland Coverage Where You Live
22nd October 2021

The levels of carbon dioxide (CO2) emissions and woodland coverage vary across the UK. Our interactive maps let you see how your area looks, and how it compares with other areas.
To help address climate change, a UK-wide target of reaching net zero greenhouse gas emissions by 2050 has been adopted. This means reducing carbon dioxide (CO2) emissions, with any remaining emissions offset by measures that remove greenhouse gases from the atmosphere, including increasing numbers of trees.
The UK Government has set a target for at least 30,000 hectares of trees a year to be planted by the end of this Parliament (May 2024), while the devolved administrations for Wales, Scotland and Northern Ireland also have plans for new woodland. The UK annual tree planting target is equivalent to an area twice the size of Cardiff or almost the size of the borough of Milton Keynes.
The Department for Business, Energy and Industrial Strategy (BEIS) produces annual CO2 emissions estimates for the UK nations, nine English regions and individual local authority areas. CO2 accounted for 80% of greenhouse gas emissions in the UK in 2019, with the rest including methane (12%), nitrous oxide (5%) and fluorinated gases (3%).
Total UK CO2 emissions fell by 36% between 2005 and 2019, but the picture varies depending on where you live.
In England, overall CO2 emissions reduced by 36% between 2005 and 2019, compared with 35% in Scotland, 29% in Wales and 23% in Northern Ireland.
Across the English regions level, between 2005 and 2019 CO2 emissions fell the most in percentage terms in the North East (56%) and the least in the East of England (30%).
Various changes have contributed to the national fall in CO2 emissions. In the energy sector and in industry, such as manufacturing, there has been a decrease in the use of coal for electricity generation and an increase in the use of renewable sources.
Note
This report by the Office for National Statistics is fulof details and links to more data.
To read the full item go HERE
PHOTO
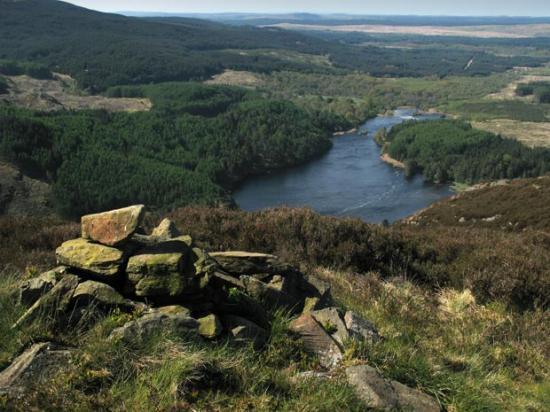
Loch Trool from Buchan Hill, Scotland
From Wikipedia under creative commons license
