Producer Price Inflation UK February 2022
23rd March 2022
The latest ONS report shows inflation affecting producers.
Main points
The headline rate of output prices showed positive growth of 10.1% on the year to February 2022, up from 9.9% in January 2022.
The headline rate of input prices showed positive growth of 14.7% on the year to February 2022, up from 14.2% in January 2022.
Food products and metals and non-metallic minerals provided the largest upward contributions to the annual rates of output and input inflation, respectively.
This month's Producer Price Inflation (PPI) is being published using updated sales data in line with the annual chain-linking methodology (see Section 5).
Measuring the data
Strengths and limitations
Related links
Print this statistical bulletin
Download as PDF
1.Main points
The headline rate of output prices showed positive growth of 10.1% on the year to February 2022, up from 9.9% in January 2022.
The headline rate of input prices showed positive growth of 14.7% on the year to February 2022, up from 14.2% in January 2022.
Food products and metals and non-metallic minerals provided the largest upward contributions to the annual rates of output and input inflation, respectively.
This month's Producer Price Inflation (PPI) is being published using updated sales data in line with the annual chain-linking methodology (see Section 5).
Back to table of contents
2.Analysis
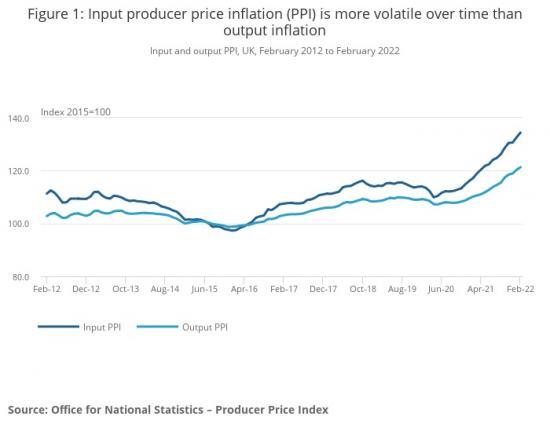
Figure 1: Input producer price inflation (PPI) is more volatile over time than output inflation
Input and output PPI, UK, February 2012 to February 2022
Input PPIOutput PPIFeb-22Apr-21Jun-20Aug-19Oct-18Dec-17Feb-17Apr-16Jun-15Aug-14Oct-13Dec-12Feb-1290.0100.0110.0120.0130.0140.0Index 2015=100
Oct-18
● Input PPI: 116.2
● Output PPI: 109.2
Source: Office for National Statistics - Producer Price Index
Download this chartFigure 1: Input producer price inflation (PPI) is more volatile over time than output inflation
Image .csv .xls
Output prices
On the month, the rate of output inflation was 0.8% in February 2022, down from 1.2% in January 2022 (Table 1).
Table 1: Output prices, index values, growth rates and percentage point change to the 12-month rate
UK, February 2021 to February 2022
All manufactured products (GB7S)
PPI Index
(2015=100) 1-month
rate 12-month
rate Change in the
12-month rate
(percentage points)
2021 Feb 110.2 0.7 1.0 0.8
Mar 110.6 0.4 1.9 0.9
Apr 111.1 0.4 3.5 1.6
May 111.8 0.7 4.3 0.8
June 112.7 0.8 4.6 0.3
July 113.8 1.0 5.3 0.7
Aug 114.6 0.7 6.2 0.9
Sept 115.4 0.7 7.0 0.8
Oct 117.4 1.7 8.8 1.8
Nov 118.5 1.0 9.4 0.6
Dec 118.9 0.3 9.3 -0.1
2022 Jan 120.3 1.2 9.9 0.6
Feb 121.3 0.8 10.1 0.2
Source: Office for National Statistics - Producer Price Index
Notes
Rates may not correspond to index value changes because of rounding.
Download this tableTable 1: Output prices, index values, growth rates and percentage point change to the 12-month rate
.xls .csv
Of the 10 product groups, nine displayed upward contributions to the annual rate in February 2022. Food products provided the largest upward contribution of 2.37 percentage points to the annual rate (Figure 2) and had annual price growth of 6.2% in February 2022 (Table 2). This is the highest that the rate has been since December 2017, and the increase was mainly driven by preserved meat and meat products for domestic market.
Tobacco and alcohol was the only product group to display a downward contribution to the annual rate. Despite showing positive annual growth, it provided a downward contribution because of the reduction in weight between 2021 and 2022.
Output - change in the annual rate
The annual rate of output inflation increased by 0.2 percentage points from 9.9% in January 2022 to 10.1% in February 2022. This is the highest that the rate has been since September 2008.
Of the 10 product groups, six displayed upward contributions to the change in the annual rate, with transport equipment and other manufactured products providing the largest, at 0.13 and 0.12 percentage points, respectively
The annual rate of imported inputs was 9.2% in February 2022, up from 7.0% in January 2022. This is the highest that the rate has been since May 2017.
Input - change in the annual rate
The annual rate of input inflation increased by 0.5 percentage points from 14.2% in January 2022 to 14.7% in February 2022.
Of the 10 product groups, five displayed upward contributions to the change in the annual rate. Crude oil displayed the largest, at 0.31 percentage points. The monthly rate of 9.0% between January 2022 and February 2022 for this product group is higher than the 6.0% between the same months a year ago; this has pulled the annual rate up by 4.2 percentage points from 53.1% in January 2022 to 57.3% in February 2022.
Read much more at https://www.ons.gov.uk/economy/inflationandpriceindices/bulletins/producerpriceinflation/february2022