Prices Rising Faster For Almost Everything
13th April 2022
The Office for National Statistics today published their latest report showing inflation is rising at the fastest rate for many years.
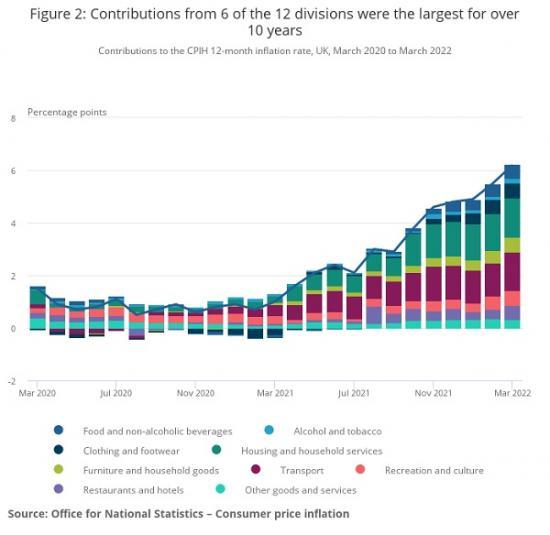
Figure 2 shows the extent to which the different categories of goods and services have contributed to the overall Consumer Prices Index including owner occupiers' housing costs (CPIH) 12-month inflation rate over the last two years.
Contributions from 6 of the 12 divisions were the largest observed for over 10 years. Of these, 4 were the highest in the National Statistics series, which began in 2006.
Housing and household services
Housing and household services contributed 1.49 percentage points to the CPIH 12-month inflation rate in March 2022. This was the largest contribution from any division this month, and the largest contribution from housing and household services since January 2009. The contribution rose significantly in October 2021 as a result of price rises for gas and electricity following the increase in the Office of Gas and Electricity Markets (Ofgem) cap on energy prices, which changed on 1 October 2021.
The Ofgem energy price caps limit the price energy suppliers can charge the estimated 15 million households that either use a prepayment meter or are on the "standard variable" energy (or default) tariff. They update the energy price caps twice a year, in April and October, and on 6 August 2021, they published the cap levels for the period from 1 October 2021 to 31 March 2022. They reported that the price cap had increased by 12% since April 2021 because of "a rise of over 50% in energy costs over the last six months with gas prices hitting a record high as the world emerges from lockdown". The rise resulted in 12-month inflation rates of 18.8% for electricity and 28.1% for gas in October 2021. These have since increased slightly to 19.2% and 28.3% respectively.
Ofgem announced the cap levels for the period from 1 April to 30 September 2022 on 3 February. They said that "Those on default tariffs paying by direct debit will see an increase of £693 from £1,277 to £1,971 per year (difference due to rounding). Prepayment customers will see an increase of £708 from £1,309 to £2,017. The increase is driven by a record rise in global gas prices over the last six months, with wholesale prices quadrupling in the last year". This latest change does not affect the consumer price indices for March. Its impact will be included in the April figures scheduled for release on 18 May 2022.
Elsewhere within housing and household services, owner occupiers' housing costs rose by 2.7% in the year to March 2022, the largest 12-month rate since 2.7% in October 2016. This resulted in a contribution of 0.50 percentage points to the CPIH annual inflation rate.
Transport
Over the last two years, the contribution from transport has ranged from a downward contribution of 0.20 percentage points in May 2020 during the first coronavirus (COVID-19) lockdown, to an upward contribution of 1.47 percentage points in March 2022. This latest contribution is the largest since before the start of the National Statistics series in January 2006.
Within transport, the movement has mainly been caused by changes in the price of motor fuels. This category made a downward contribution to the 12-month rate between March 2020 and February 2021, before the contribution turned positive in March 2021 and subsequently increased to 0.68 percentage points in March 2022. This is the largest contribution since April 2010.
Average petrol prices stood at 160.2 pence per litre in March 2022, compared with 123.7 pence per litre a year earlier. The March 2022 price is the highest recorded. The average price of diesel in March 2022, 170.5 pence per litre, was also the highest on record. The 12-month rate for motor fuels and lubricants was 30.7%, the highest since before the start of the historic modelled series in January 1989.
The contribution from second-hand cars has also changed significantly since the beginning of 2020, rising from a downward effect of 0.07 percentage points in January 2020 to an upward pull of 0.15 percentage points in October 2020. With the onset of the coronavirus pandemic, there were reports of increased demand as people sought alternatives to public transport. From October 2020, the contribution to the 12-month rate gradually fell back to an upward 0.01 percentage points in April 2021. It then rose again to 0.36 percentage points in February 2022 and is little changed in March 2022.
The movement from April 2021 comes amidst reports of increased demand, together with a global semiconductor shortage affecting the production of new cars, resulting in consumers turning to the used car market. Additionally, there have reportedly been concerns in the trade about the supply of second-hand cars because of a variety of factors. These include fewer one-year-old cars coming to the market because of a fall in new car registrations a year earlier, and the extensions of lease contracts and fewer part exchanges caused again by delays in new-car supply. The March 2022 prices economic analysis considers further the growth in second-hand car prices.
Other divisions
The contributions from three of the other divisions were higher in March 2022 than at any other point since before the start of the National Statistics series in January 2006. Clothing and footwear prices rose by 9.7% in the year to March 2022, resulting in a contribution of 0.57 percentage points to the all items 12-month rate. Prices for furniture, household equipment and maintenance rose by 10.4% in the year to March, also contributing 0.57 percentage points to the headline rate. Prices, overall, for recreational and cultural goods and services rose by 5.0% to March, contributing 0.55 percentage points. Additionally, prices for food and non-alcoholic beverages rose by 5.9% on the year, resulting in a contribution of 0.53 percentage points, the highest 12-month rate and contribution for this category since September 2011.
Transport
The largest upward contribution to the change in the CPIH 12-month inflation rate came from transport, where prices, overall, rose by 2.4% between February and March 2022, compared with a smaller rise of 0.7% between the same two months a year ago. Almost all the 0.21 percentage points upward contribution came from motor fuels.
Average petrol prices rose by 12.6 pence per litre between February and March 2022, the largest monthly rise on record (since 1990). This compares with a rise of 3.5 pence per litre between the same months of 2021. Similarly, diesel prices rose by 18.8 pence per litre this year, compared with a rise of 3.5 pence per litre a year ago.
Restaurants and hotels
There was also a large upward contribution to change (of 0.17 percentage points) from restaurants and hotels. Prices rose, overall, by 2.0% between February and March 2022, the largest change between these months since the start of the historic constructed series in 1988. The upward effect came principally from alcoholic drinks served in restaurants, cafes and public houses, and from accommodation services.
It should be noted that many items within this division were unavailable in March 2021 because of lockdowns that were in place across the UK. Unavailable items were imputed as described in our Coronavirus and the effects on UK prices article. This means that monthly movements for those items in 2021 reflect imputed index movements and should therefore be interpreted with caution.
Housing, water, electricity, gas and other fuels
The upward contribution of 0.10 percentage points from this division came mostly from liquid fuels, where prices of kerosene for domestic heating rose by 44.0% between February and March 2022, compared with a rise of 2.9% a year ago. There was also an upward contribution from owner occupiers' housing costs which rose by 0.2% this year but were little changed a year ago.
Furniture and household goods
Rising prices for furniture and household goods led to an increase of 0.09 percentage points in the overall CPIH 12-month inflation rate between February and March 2022. Prices rose by 1.9% on the month in 2022, compared with a smaller rise of 0.8% a year earlier. The effect was principally from furniture and furnishings (0.06 percentage points), particularly lounge and bedroom furniture.
Small upward contributions came from household textiles, major appliances, and tools and equipment for house and garden.
Food and non-alcoholic beverages
Food and non-alcoholic beverages provided an upward contribution of 0.07 percentage points as prices rose by 0.2% this year, compared with a fall of 0.6% a year ago. There were small upward contributions from 6 of the 11 detailed classes, with the largest coming from oils and fats (principally margarine and low fat spread), and milk, cheese and eggs.
Alcoholic beverages and tobacco
Prices of alcohol and tobacco rose by 1.1% in 2022, compared with a fall of 0.1% in 2021, leading to an upward contribution to change of 0.05 percentage points. The upward effect came from a combination of tobacco (particularly cigarettes) and spirits such as vodka and whisky.
Read the full report at https://www.ons.gov.uk/economy/inflationandpriceindices/bulletins/consumerpriceinflation/march2022