Economy Inflation And Price Indices - Tracking The Price Of The Lowest-cost Grocery Items
30th May 2022
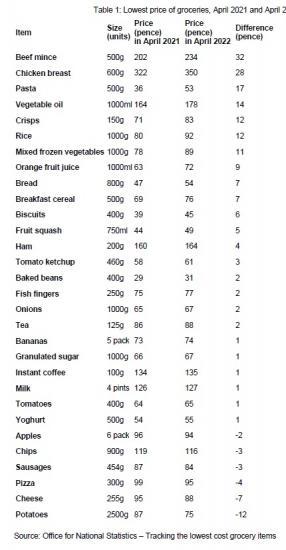
How the prices of the lowest-cost products for 30 everyday items have changed since April 2021.
Main points
Highly experimental research, based on web-scraped supermarket data for 30 everyday grocery items, shows that the lowest-priced items have increased in cost by around as much as average food and non-alcoholic drinks prices (with both rising around 6% to 7% over the 12 months to April 2022).
There is considerable variation across the 30 items, with the prices for six items falling over the year, but the prices of five items rising by 15% or more.
The difference between the lowest-cost version of an item and the next lowest-cost version of it is often large; for over two-thirds of the items monitored, the next item was at least 20% more expensive.
Price movements for each grocery item
The lowest-priced everyday grocery items have seen a notable variation in price change, with some items showing increases of over 15%, while other items fell in price
There was a very wide range of price movements for the lowest prices, when looking over the year to April 2022.
For 13 of the 30 sampled items monitored, the average lowest price, across the seven retailers, increased at a faster rate than the latest available official consumer price inflation measure for food and non-alcoholic beverages (a 6.7% increase over the 12 months to April 2022). For 10 items, the lowest-cost price increased by more than 10%, and for 5 of those 10 items the lowest-cost price rose by 15% or more.
The items where the lowest prices rose at the fastest rate were pasta (up 50% between April 2021 and April 2022), crisps (17%), bread (16%), minced beef (16%) and rice (15%).
For 6 of the 30 items, the lowest prices fell on average over the 12 months to April 2022. Price decreases were measured for potatoes (a 14% fall in price), cheese (7%), pizza (4%), chips (3%), sausages (3%) and apples (1%).
It is important to consider that for each of the 30 items, the overall figure can be made up of different price movements at the product level.
An example of this is vegetable oil - which could be drawn from a variety of products including sunflower oil and rapeseed oil - where prices rose by 9%. However, for vegetable oil, there are instances where we are missing some product-level price data, at some retailers, for the cheapest oils. In one case, this caused us to track the price of a more expensive oil. For these reasons, the estimate of 9% should be treated with additional caution.
next lowest-priced item
Lowest-cost grocery item data
Glossary
Measuring the data
Strengths and limitations
Future plans
Related links
Print this article
Download as PDF
1.Main points
Highly experimental research, based on web-scraped supermarket data for 30 everyday grocery items, shows that the lowest-priced items have increased in cost by around as much as average food and non-alcoholic drinks prices (with both rising around 6% to 7% over the 12 months to April 2022).
There is considerable variation across the 30 items, with the prices for six items falling over the year, but the prices of five items rising by 15% or more.
The difference between the lowest-cost version of an item and the next lowest-cost version of it is often large; for over two-thirds of the items monitored, the next item was at least 20% more expensive.
The data provided in this article are highly experimental; varying the methodology, particularly the choice of substitutes for missing products, could give notably different estimates: more information on why we have chosen this approach is available in Section 9: Strengths and limitations.
!
Data and analysis in this article have been produced using new, innovative methods and as a result are less robust than official statistics.
Back to table of contents
2.Price changes for lowest-cost items
Using innovative analytical methods to track the lowest-priced grocery items
With rising prices seen across many goods and services, the Office for National Statistics (ONS) has looked at the question of how prices of everyday grocery items have changed for the lowest-cost products.
To try to answer this, we apply new and highly experimental methods, making use of web-scraped supermarket data to capture the price changes of everyday grocery items. Over the year to April 2022, online grocery price quotes were collected from seven major supermarket retailers' websites. Prices were assessed for 30 everyday food and drink items, covering fresh fruit and vegetables, cupboard staples, chilled products, as well as meat and fish.
Back to table of contents
3.Price movements for each grocery item
The lowest-priced everyday grocery items have seen a notable variation in price change, with some items showing increases of over 15%, while other items fell in price
There was a very wide range of price movements for the lowest prices, when looking over the year to April 2022.
For 13 of the 30 sampled items monitored, the average lowest price, across the seven retailers, increased at a faster rate than the latest available official consumer price inflation measure for food and non-alcoholic beverages (a 6.7% increase over the 12 months to April 2022). For 10 items, the lowest-cost price increased by more than 10%, and for 5 of those 10 items the lowest-cost price rose by 15% or more.
The items where the lowest prices rose at the fastest rate were pasta (up 50% between April 2021 and April 2022), crisps (17%), bread (16%), minced beef (16%) and rice (15%).
For 6 of the 30 items, the lowest prices fell on average over the 12 months to April 2022. Price decreases were measured for potatoes (a 14% fall in price), cheese (7%), pizza (4%), chips (3%), sausages (3%) and apples (1%).
It is important to consider that for each of the 30 items, the overall figure can be made up of different price movements at the product level.
An example of this is vegetable oil - which could be drawn from a variety of products including sunflower oil and rapeseed oil - where prices rose by 9%. However, for vegetable oil, there are instances where we are missing some product-level price data, at some retailers, for the cheapest oils. In one case, this caused us to track the price of a more expensive oil. For these reasons, the estimate of 9% should be treated with additional caution. We provide further explanation on issues with the data used for this analysis in Section 9: Strengths and limitations.
In cash terms, the largest price rises, on average, were measured for beef mince (up 32 pence for 500g to £2.34) and chicken breast (up 28 pence to £3.50 for 600g). Pasta (an increase of 17 pence), vegetable oil (14 pence), and crisps and rice (both increased by 12 pence) showed the next largest increases in cash terms.
The largest average fall in the lowest price was measured for potatoes (down 12 pence to 75 pence for a 2.5kg bag), followed by cheese (down 7 pence to 88 pence for 255g) and pizza (down 4 pence to 95 pence for 300g).
Combining the lowest-cost items into an index shows that, overall, the prices of the cheapest items has risen since April 2021 in line with official measures of inflation
Figure 3 shows that an overall groceries index that combines the lowest prices of 30 everyday items follows a similar trend to official measures of inflation for the food and non-alcoholic beverages component of the consumer price index including owner occupiers' housing costs (CPIH).
The lowest prices of the 30 everyday items, weighted by retailer and item, rose by 6.0% in the year to April 2022. When comparing March 2022 with April 2022, the lowest prices rose by 0.9%. Section 9: Strengths and limitations, provides more information on the approach to weighting retailers and items.
Over the month from March to April 2022, the items that saw the largest increase in the lowest price were breakfast cereal (up 6%), mixed frozen vegetables and vegetable oil (both increased by 5%).
Looking across all items over time, there was some evidence of shrinkflation - with pack sizes reducing but costing the same. Since the item size is collected by the web scrapers, this analysis accounts for changes to the product size.
It is also worth noting that there was evidence that sugar-free or low-salt versions of some lowest-cost items are often the same price as the standard versions of these products.
Difference between the lowest-priced and next lowest-priced item
Items may not always be available instore or online, which is reflected in the data picked up by our web scrapers. Value ranges often represent a substantial saving and, where they are not available, the price difference to the next lowest-priced available item is often large.
By looking at all the available products within an item category, the difference between the lowest-cost and next lowest-priced item can be calculated. For over two-thirds of the sample items, the cost of substituting an item would have been at least 20% higher than the previous lowest-cost item. For four items, the difference was more than 50%.
Read the full report HERE