Consumer Price Inflation UK - May 2022 - Inflation 9.1%
22nd June 2022
The Office for National Statistics published its monthly report today 22 June 2022.
The Consumer Prices Index including owner occupiers' housing costs (CPIH) rose by 7.9% in the 12 months to May 2022, up from 7.8% in April.
The largest upward contributions to the annual CPIH inflation rate in May 2022 came from housing and household services (2.79 percentage points, principally from electricity, gas and other fuels, and owner occupiers' housing costs) and transport (1.50 percentage points, principally from motor fuels and second-hand cars).
On a monthly basis, CPIH rose by 0.6% in May 2022, compared with a rise of 0.5% in May 2021.
The Consumer Prices Index (CPI) rose by 9.1% in the 12 months to May 2022, up from 9.0% in April.
On a monthly basis, CPI rose by 0.7% in May 2022, compared with a rise of 0.6% in May 2021.
Rising prices for food and non-alcoholic beverages, compared with falls a year ago, resulted in the largest upward contribution to the change in both the CPIH and CPI 12-month inflation rates between April and May 2022 (0.17 percentage points for CPIH).
The largest offsetting downward contributions to change in the rates were from recreation and culture (0.10 percentage points for CPIH) and clothing and footwear (0.08 percentage points for CPIH).
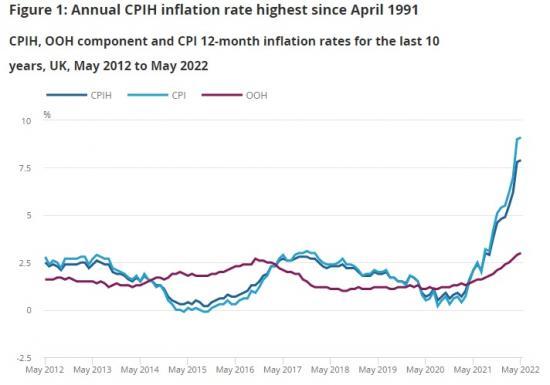
The Consumer Prices Index including owner occupiers' housing costs (CPIH) rose by 7.9% in the 12 months to May 2022, up from 7.8% in April. This is the highest recorded 12-month inflation rate in the National Statistic series, which began in January 2006. The rate was last higher in the constructed historic estimates in April 1991 when it stood at 8.0%.
The Consumer Prices Index (CPI) rose by 9.1% in the 12 months to May 2022, up from 9.0% in April. This is the highest CPI 12-month inflation rate in the National Statistic series, which began in January 1997. Indicative modelled consumer price inflation estimates suggest that CPI would last have been higher around 1982, where estimates range from nearly 11% in January down to approximately 6.5% in December.
On a monthly basis, CPIH rose by 0.6% in May 2022, compared with a rise of 0.5% in the same month a year earlier. The CPI monthly rate was 0.7%, compared with 0.6% in May 2021. Rising prices for food and non-alcoholic beverages resulted in the largest upward contribution to the monthly rates in May 2022. In May 2021, the main upward contributions to the monthly rates came from clothing and footwear, and recreation and culture.
Given that the owner occupiers' housing costs (OOH) component accounts for around 17% of the CPIH, it is the main driver for differences between the CPIH and CPI inflation rates. The inclusion of Council Tax and rates in CPIH is the only further difference in coverage. This makes CPIH our most comprehensive measure of inflation and, therefore, the commentary in this bulletin focusses on CPIH. While the coverage differs, the key drivers of the 12-month inflation rate are the same where they are common to both measures. Section 5 is intended to focus on the elements of the basket that are unique to CPIH.
Housing and household services
Housing and household services contributed 2.79 percentage points to the CPIH 12-month inflation rate in May 2022. This was the largest contribution from any division this month, and the largest contribution from housing and household services in the National Statistic series. (The series begins in January 2006, contributions data are not available in the earlier constructed historical series between 1989 and 2005.) The contribution rose significantly in April 2022 as a result of price rises for gas and electricity following the increase in the Office of Gas and Electricity Markets (Ofgem) cap on energy prices on 1 April 2022. This followed an earlier rise in the price cap on 1 October 2021.
The Ofgem energy price caps limit the price energy suppliers can charge the estimated 15 million households that either use a prepayment meter or are on the "standard variable" energy (or default) tariff. They currently update the energy price caps twice a year, in April and October, and on 3 February, Ofgem announced the cap levels for the period from 1 April to 30 September 2022. They said that "Those on default tariffs paying by direct debit will see an increase of £693 from £1,277 to £1,971 per year (difference due to rounding). Prepayment customers will see an increase of £708 from £1,309 to £2,017. The increase is driven by a record rise in global gas prices over the last six months, with wholesale prices quadrupling in the last year". The rise resulted in 12-month inflation rates of 53.5% for electricity and 95.5% for gas in April. These are unchanged in May leading to a contribution to the 12-month rate of 1.87 percentage points from electricity, gas and other fuels in total.
Elsewhere within housing and household services, owner occupiers' housing costs rose by 3.0% in the year to May 2022. This was the largest 12-month rate in the National Statistic series, which began in January 2006, and the largest since April 1999 in the earlier historical constructed series, when it was 3.2%. The May 2022 rate resulted in a contribution of 0.54 percentage points to the CPIH annual inflation rate.
Transport
Over the past two years, the contribution from transport has varied from a downward contribution of 0.18 percentage points in June 2020 (during the first coronavirus (COVID-19) lockdown) to an upward contribution of 1.50 percentage points in May 2022. This is up from 1.47 percentage points in April and is the largest contribution from transport in the National Statistics series, which began in January 2006.
Within transport, the movement has mainly been caused by changes in the price of motor fuels. This category made a downward contribution to the 12-month rate between March 2020 and February 2021, before the contribution turned positive in March 2021 and subsequently increased to 0.74 percentage points in May 2022. This is the largest contribution since July 2008, when it was also 0.74 percentage points.
Average petrol prices stood at 165.9 pence per litre in May 2022, compared with 127.2 pence per litre a year earlier. The May 2022 price is the highest recorded. The average price of diesel in May 2022, which was 179.7 pence per litre, was also the highest on record. The 12-month rate for motor fuels was 32.8%, the highest since before the start of the constructed historical series in January 1989.
The contribution from second-hand cars has also changed over recent years. For example, it rose from an upward 0.01 percentage points in April 2021 to 0.36 percentage points in February and March 2022, before falling back to 0.25 percentage points in May 2022.
The increase from April 2021 came when there were reports of increased demand, with a global semiconductor shortage affecting the production of new cars, resulting in consumers turning to the used car market. Additionally, there were reportedly concerns in the trade about the supply of second-hand cars because of a variety of factors. These include fewer one-year-old cars coming to the market because of a fall in new car registrations a year earlier, and the extensions of lease contracts and fewer part exchanges caused again by delays in new-car supply. The March 2022 prices economic analysis considered further the growth in second-hand car prices.
Other divisions
Three other divisions made contributions of 0.6 percentage points or more to the CPIH annual rate. Prices for food and non-alcoholic beverages rose by 8.7% in the year to May 2022, resulting in a contribution of 0.78 percentage points to the all-items rate. This was the largest contribution from this division since March 2009.
The contribution from restaurants and hotels was 0.64 percentage points in May 2022, unchanged from April. These contributions were 0.01 percentage points lower than the previous largest contribution of 0.65 percentage points, which occurred in August 2021. The contribution for that period was influenced by the reduced prices recorded in August 2020 as a result of the Eat Out to Help Out scheme.
Prices for furniture, household equipment and maintenance rose by 11.0% in the year to May 2022. The resulting contribution of 0.60 percentage points was the highest from this division in the National Statistic series, which began in January 2006.
Food and non-alcoholic beverages
The largest upward contribution to the change in the CPIH 12-month inflation rate came from food and non-alcoholic beverages. Overall, prices rose by 1.5% between April and May 2022, compared with a fall of 0.3% between the same two months a year ago. The upward movement was broad-based, with upward contributions from 7 of the 11 detailed classes. The largest contributions were from bread and cereals, and meat. Prices rose in both classes this year, compared with falls a year ago, with small upward effects from the majority of items in the classes. The only class with a small, partially offsetting, downward contribution was fruit, where prices were little changed this year but rose a year ago.
Transport
There was a smaller upward contribution to change (of 0.03 percentage points) from transport. Overall, prices rose by 0.6% between April and May 2022, compared with a smaller rise of 0.3% between the same months a year ago. The main upward effect came from motor fuels. Average petrol prices rose by 4.1 pence per litre in May this year, compared with a smaller rise of 1.7 pence per litre a year ago. Diesel prices moved similarly, with a rise of 3.6 pence per litre this year, compared with 1.5 pence per litre a year ago.
Within transport, there was an offsetting, downward contribution from second-hand cars, where prices fell this year but rose a year ago. In 2021, there were reports of increased demand, combined with reports of restricted supply.
Furniture and household goods
Rising prices for furniture and household goods led to an increase of 0.03 percentage points in the overall CPIH 12-month inflation rate between April and May 2022. Prices rose by 1.1% on the month in 2022, compared with a smaller rise of 0.8% a year earlier. The upward contribution comprised small effects from across furniture and furnishings (principally bedroom furniture), household textiles and glassware, tableware and household utensils.
Housing and household services
There was also a small 0.03 percentage point upward contribution from housing and household services, where prices rose by more this year than in 2021. Small upward effects came from owner occupiers' housing costs, liquid fuels and rents.
Recreation and culture
The largest, partially offsetting, downward contribution to the change in the CPIH 12-month inflation rate of 0.10 percentage points came from recreation and culture. Games, toys and hobbies contributed 0.08 percentage points to the change, with overall prices falling by 2.4% this year, compared with a rise of 2.8% a year earlier. The movement largely reflects price changes for computer games, particularly computer game downloads. Price movements for computer games can sometimes be large, in part depending on the composition of bestseller charts, so short-term movements need to be interpreted with caution.
Within this division, there was a smaller downward contribution of 0.02 percentage points from equipment for the reception and reproduction of sound and pictures, where prices of televisions fell this year but rose a year ago.
Clothing and footwear
There was a further offsetting downward contribution (of 0.08 percentage points) to the change in the rate from clothing and footwear. Prices rose by 1.1% this year but rose by a larger 2.3% a year ago. Last year's rise was higher than usual for the time of year. It was influenced by a large fall in the amount of discounting recorded in the dataset as the country continued to open following the coronavirus (COVID-19) lockdown in the first quarter of 2021. The effect came from women's clothing and, to a lesser extent, men’s clothing and footwear.
Unavailable items
For items that were unavailable (based on government guidelines) in the early part of 2021, there were no January base prices. As these items became available again, base prices were imputed in line with the procedures described in the Coronavirus (COVID-19) and Consumer Price Inflation weights and prices: 2021 article.
For the first month in which they became available again, item indices were imputed using either the monthly movement or, for a smaller number of seasonal items, the annual movement in the all-available-items index. The aim was that the indices for returning items had a negligible impact on the all-items inflation rate in the first month of return. This reflects the fact that these services were available only as price levels and did not have price growth associated with them (relative to the January base). Collected prices then started to influence the index in the following month.
Restrictions began easing from 12 April 2021 and, since August 2021, there are no items across the CPIH basket of goods and services that are unavailable to consumers.
However, the 12-month rate depends on prices collected in both 2022 and 2021. In May 2021, national restrictions were easing in the UK, leaving 27 CPIH items unavailable to UK consumers. The list of unavailable items is shown in Table 58 of the Consumer price inflation dataset.
A number of items affected by lockdown restrictions in 2021 have contributed to the change in the CPIH 12-month inflation rate between April and May 2022. These items were imputed in April and May 2021, reflecting their unavailability for consumption. For more information, please refer to the Coronavirus and the effects on UK prices article.
Contributions to change from affected items are generally small (less than or equal to 0.02 percentage points in magnitude). In aggregate, the effect was to increase the CPIH 12-month inflation rate by 0.02 percentage points between April and May 2022, and to increase the CPI rate, also, by 0.02 percentage points. The contribution to the 12-month inflation rate in May 2022 for these items was 0.36 percentage points in CPIH and 0.41 percentage points in CPI.
Read the full report HERE