Companies Register Activities: 2021 To 2022 Record Numbers - 753,168 company incorporations
8th July 2022
1. Introduction
This release provides information about the population of companies and corporate bodies in the United Kingdom. Companies and corporate bodies are specific legal forms of business that are registered at Companies House. Companies form a subset of corporate bodies and are formed under the Companies Act 2006. Companies and corporate bodies are registered at Companies House regardless of whether they go on to trade actively. Full definitions of both companies covered by the Companies Act 2006 and corporate bodies are provided in the separate "Companies House official statistics: definitions to accompany statistical releases" document. This document also explains the incorporation, dissolution and restoration processes.
This release complements the quarterly Incorporated Companies in the UK release by providing information on both companies to which the Companies Act 2006 relates, and on wider corporate body types. Sections 2 to 4 of this release focus specifically on companies, while sections 5 and 6 cover all corporate body types. Some figures in this release may differ to those provided in the quarterly Incorporated Companies in the UK publications due to the timing of the analysis. Analyses for the figures in this release are undertaken later in the year, allowing more information to be processed and added to the register.
The statistics in this release include the total number of incorporated companies, newly incorporated companies, and the number of companies that were dissolved. The release focuses on the headline messages for the United Kingdom: figures for the constituent countries are contained in the supplementary tables that accompany the release.
Key points
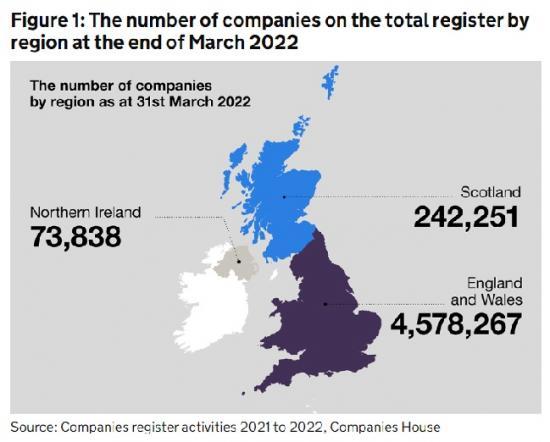
The total register size at the end of March 2022 was 4,894,356, an increase of 3.8% when compared with the end of March 2021.
There were 753,168 company incorporations in 2021 to 2022, a decrease of 7.1% when compared with 2020 to 2021. 2021 to 2022 saw the second highest number of incorporations on record.
In 2021 to 2022, there were 581,824 dissolutions in the UK, an increase of 32.9% when compared with 2020 to 2021. This is the highest number of dissolutions on record.
The average age of a company on the total register at the end of March 2022 was 8.6 years.
From 2004 to 2005, private limited companies have consistently accounted for over 96% of all corporate body types. During this time, the three corporate body types accounting for the highest proportion of all corporate body types have remained unchanged. These are private limited companies, limited partnerships and limited liability partnerships.
At the end of March 2022, the number of overseas companies on the register with a physical presence in the UK increased to 13,496 from 12,475 at the end of March 2021. This is an 8.2% increase when compared with 2020 to 2021. The largest share of overseas corporate bodies on the register originated in the USA, which accounted for 19.3% of all overseas companies. The Channel Islands overtook the Republic of Ireland as the second highest originating country, accounting for 11.9% of all overseas companies.
Key events
In response to the coronavirus (COVID-19) pandemic and national lockdown measures introduced in March 2020, a set of easements were announced by Companies House on 16 April 2020. They included the temporary pause of the strike off process (voluntary and compulsory) to give businesses affected by the coronavirus (COVID-19) pandemic the time they needed to update their records filed with Companies House and help them avoid being struck off the register. The impact of this announcement was that compulsory dissolutions from 2 April 2020 onwards were temporarily paused, as was the final stage of voluntary dissolutions.
On 10 September 2020 the voluntary strike off process resumed by a phased release through the remainder of September and into October. This removed the majority of companies that applied to be struck off before July 2020 and included some companies that filed for dissolution before the first UK-wide coronavirus (COVID-19) lockdown began in March 2020. The release of paused compulsory dissolutions began on 10 October 2020.
In response to the ongoing coronavirus (COVID-19) pandemic, there was a second pause of the voluntary and compulsory strike off processes between 21 January and 8 March 2021. Companies House temporarily paused the strike off processes so that companies and creditors would not be adversely affected by processing delays.
As part of the Corporate Insolvency and Governance Act, companies were granted automatic extensions to their filing deadlines, which may have affected the volume of dissolutions in 2020 and 2021.
Once a company starts the dissolution process (voluntary or compulsory), there is an opportunity for others to object to the dissolution and strike off. During the coronavirus (COVID-19) pandemic, the government operated several loan schemes to support companies. The government acts as a Guarantor for these loans, and objects to strike-off proceedings if there is an outstanding Bounce Back Loan, Coronavirus Business Interruption Loan, Coronavirus Large Business Interruption Loan, or Recovery Loan in place. The objection is only removed once the lender confirms that there is no longer an outstanding loan in place. This has been a contributing factor to an increase in the number of companies in the process of removal since the first quarter of 2021.
2. Incorporated companies
The total register size - including those in the process of dissolution and liquidation (395,014) - at the end of March 2022 was 4,894,356. This is an increase of 3.8% when compared with the end of March 2021. The effective register, which does not include those in the process of dissolution or liquidation, at the end of March 2022 was 4,499,342.
The total register increased in size across all constituent countries of the UK - England and Wales by 3.9%, Northern Ireland by 4.8%, and Scotland by 2.2%.
During 2021 to 2022, there were 753,168 company incorporations, a decrease of 7.1% when compared with the previous financial year. 2021 to 2022 saw the second highest number of incorporations on record. The highest number of incorporations on record was in 2020 to 2021.
In the same year, there were 581,824 dissolutions, an increase of 32.9% when compared with 2020 to 2021. This is the highest number of dissolutions on record. Due to legislative easements introduced during the coronavirus (COVID-19) pandemic, compulsory and voluntary dissolutions were paused for approximately 8 months during the 2020 to 2021 financial year. Therefore, we could be seeing dissolutions in 2021 to 2022 that would have originally occurred during 2020 to 2021 if easements were not in place.
The highest rate of increase in the number of dissolutions in 2021/22 were found in England and Wales (33.6%), followed by Northern Ireland (26.1%) and Scotland (21.6%).
Despite fluctuations, the number of incorporations and dissolutions over time have increased at a steady rate. There were 635,368 more incorporations in 2021 to 2022 when compared with the number of incorporations in 1986 to 1987, when the reporting of financial-year data began. There were 497,624 more dissolutions in 2021 to 2022 when compared with 1986 to 1987.
Notes: ‘UK Registry' refers to the addition of Northern Ireland to the Great Britain companies register.
During 2021 to 2022 there were 17,035 insolvent liquidations, a year on year increase of 63.2%. In the same year, there were 11,824 members' voluntary liquidations, a decrease of 20.7% when compared with 2020 to 2021. These movements were observed in England and Wales and Scotland; however, Northern Ireland saw an increase in the number of members' voluntary liquidations. There were 30,330 liquidations and other insolvency proceedings in total during 2021 to 2022, an increase of 10.9% when compared with 2020 to 2021. For further information please see Company Insolvency Statistics Releases - GOV.UK (www.gov.uk).
A full breakdown of figures for England and Wales, Scotland, Northern Ireland and the UK as a whole is provided in Table A1 in the spreadsheets that accompany this release. Figures are provided for the years 2012 to 2013 through to 2021 to 2022. Separate figures for private companies and public limited companies are provided in Tables A2 and A3 respectively. Liquidation figures are provided in Table A10.
3. The growth in the register size over time
Between 1979 and 2022, the total register has increased by 4.1 million companies, whilst the effective register has increased by 3.8 million companies [footnote 1] [footnote 2]. During this time, the total register has seen 39 annual increases, whilst the effective register has increased 37 times over the same period.
In the late 2000s, it was anticipated that the register size would increase due to the introduction of Northern Ireland companies to the UK register. However, this may have been offset by the global financial crisis during the same period leading to a slight decrease in the register size overall.
During the period 2009 to 2010 there were also several significant changes to the register:
The Northern Ireland register was included to create a UK register, as mentioned above;
There was a change in the administrative system that forms the register;
There was a purge on the register to remove defunct companies that had spent an extended period in the process of dissolution or liquidation;
Legislative changes were introduced under the Companies Act 2006, which reduced the time taken to dissolve companies and remove them from the register.
These changes in combination are likely to have contributed to a sharp increase in the number of dissolutions between 2009 and 2010. This may in turn have had an impact on the overall sizes of the total and effective registers.
Since 2010 to 2011, both registers have continued to increase steadily in size.
Between 2012 to 2013 and 2021 to 2022, the average growth rate for the total and effective registers was 5.4% and 5.5% respectively. During 2021 to 2022, the growth rates decreased to 3.8% for the total register and 2.0% for the effective register, from a peak of 8.4% and 8.5% respectively during 2020 to 2021. This peak in the previous financial year is linked to the record number of incorporations combined with a lower number of dissolutions due to legislative easements in place during the coronavirus (COVID-19) pandemic.
To read the full report with more graphs and links go HERE