UK inflation hits 10.1% - Highest Since 1990
17th August 2022
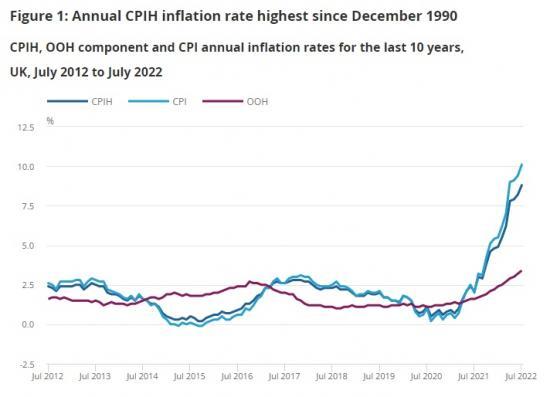
The Consumer Prices Index including owner occupiers' housing costs (CPIH) rose by 8.8% in the 12 months to July 2022, up from 8.2% in June.
The largest upward contributions to the annual CPIH inflation rate in July 2022 came from housing and household services (principally from electricity, gas and other fuels, and owner occupiers' housing costs), transport (principally motor fuels), and food and non-alcoholic beverages.
On a monthly basis, CPIH rose by 0.6% in July 2022, compared with no change in July 2021.
The Consumer Prices Index (CPI) rose by 10.1% in the 12 months to July 2022, up from 9.4% in June.
On a monthly basis, CPI also rose by 0.6% in July 2022, compared with no change in July 2021.
Rising food prices made the largest upward contribution to the change in both the CPIH and CPI annual inflation rates between June and July 2022.
Consumer price inflation
The Consumer Prices Index including owner occupiers' housing costs (CPIH) rose by 8.8% in the 12 months to July 2022, up from 8.2% in June. The annual rate was below 1.2% from April 2020, at the start of the first coronavirus (COVID-19) lockdown, to March 2021. The rate has since risen markedly. The July 2022 figure is the highest recorded annual inflation rate in the National Statistic series, which began in January 2006. The rate was last higher in our constructed historical estimates in December 1990, when it stood at 9.2%. The largest contributions to the annual rate in July 2022 are from housing and household services, transport, and food and non-alcoholic beverages. Their effects are shown in Figure 5 in Section 4.
The Consumer Prices Index (CPI) rose by 10.1% in the 12 months to July 2022, up from 9.4% in June. Similar to the CPIH, the rate has risen sharply over recent months and the July figure was the highest annual CPI inflation rate in the National Statistic series, which began in January 1997. Indicative modelled consumer price inflation estimates suggest that the CPI rate would last have been higher around 1982, where estimates range from nearly 11% in January down to approximately 6.5% in December. The main contributors to the July 2022 rate are shown in Figure 9 in Section 5.
On a monthly basis, both CPIH and CPI rose by 0.6% in July 2022, compared with no change in July 2021. The CPIH and CPI monthly rates for July 2022 were the largest rises between June and July since the start of the historical constructed series in 1988. The food and non-alcoholic beverages, and transport divisions made the largest upward contributions to the monthly rates in July 2022. In June 2021, the main upward contribution to the monthly rates came from transport overall.
Given that the owner occupiers' housing costs (OOH) component accounts for around 17% of the CPIH, it is the main driver for differences between the CPIH and CPI inflation rates. The inclusion of Council Tax and rates in CPIH is the only further difference in coverage. This makes CPIH our most comprehensive measure of inflation and, therefore, the figures in Section 3 and overall commentary in Section 4 in this bulletin focus on CPIH. While the coverage differs, the key drivers of the annual inflation rate are the same where they are common to both measures. Section 5 comments, mostly graphically, on the CPI.
Notable movements in prices
The rise in inflation this month reflected prices rises across many parts of the basket. The largest movement (of 0.26 percentage points) in the annual Consumer Prices Index including owner occupiers' housing costs (CPIH) inflation rate in July 2022 came from food and non-alcoholic beverages. This upward movement was three times the size of the next largest contribution - from recreation and culture (0.09 percentage points).
Food and non-alcoholic beverages
Food and non-alcoholic beverage prices have continued to rise. There was an overall increase of 2.3% between June and July 2022, taking the division's annual inflation rate to 12.7% in July 2022, up from 9.8% in June. This month's rise in prices follows three months of increases (of between 1.2% and 1.5%) and is the highest monthly increase since May 2001, when the constructed historical estimates recorded food and non-alcoholic beverage annual inflation to be 2.8%. The annual rate of inflation was last higher in August 2008, when inflation for food and non-alcoholic beverages was 13.2%.
All the eleven food and non-alcoholic beverage classes made upward contributions to the change in the annual inflation rate, where prices overall rose this year but fell a year ago. The largest upward contributions (of 0.04 percentage points) came from bread and cereals, and from milk, cheese and eggs - where prices for shop-bought and delivered milk, cheddar cheese and yoghurts (or fromage frais) increased notably. Other smaller effects (of 0.03 percentage points) came from meat (notably from cooked ham and bacon), vegetables including tubers, and sugar, jam, syrups, chocolate and confectionery.
Recreation and culture
The annual rate for recreation and culture was 5.6% in the year to July 2022, up from 4.8% in June. This is the sixth month in succession where the annual inflation rate for recreation and culture has been 4.7% or more.
Overall prices rose by 0.4% between June and July 2022, compared with a comparable fall of 0.4% the previous year. There were upward contributions from pet related products (principally from pet food), recording media, package holidays, and games, toys and hobbies, amongst other items.
There was a partially offsetting small downward contribution from garden plants and flowers, where prices for potted shrubs fell between June and July 2022 but increased a year ago.
Housing and household services
Overall, prices for housing and household services increased by 9.1% in the year to July 2022, from 8.9% in June. This follows an increase of 0.4% between June and July 2022, compared with a smaller increase (of 0.1%) last year. The annual rate for housing and household services was last higher in March 1991, when it was estimated to be 12.5%.
The upward contribution, to the change in the annual inflation rate, principally came from owner occupiers' housing costs and because of rises to average charges for registered social landlord (RSL) rents. Prices rose between June and July 2022 and by more than a year ago.
Miscellaneous goods and services
Prices for miscellaneous goods and services increased by 4.0% in the year to July 2022, up from 3.1% in June 2022. This is the highest annual inflation rate for this division since June 2006, when it was 4.4%.
All classes in this division made small increases to the contribution to the CPIH annual rate, with the largest movement coming from appliances and products for personal care. Prices for toilet rolls, toothbrushes, electric hair styling appliances (like hair straighteners), and deodorants and anti-perspirants rose between June and July 2022, but fell between the same two months a year ago. There were partially offsetting downward contributions from toothpaste and shower gel, which both fell in price this year but had increased between June and July 2021.
Restaurants and hotels
Restaurant and hotel prices rose by 9.0% in the year to July 2022, up from 8.6% in June. This annual rate was the highest recorded in the National Statistics series, exceeding the 8.6% recorded last month and in August 2021, which was a result of the previous year's Eat Out to Help Out scheme.
Overall prices rose by 0.9% between June and July 2022, compared with a smaller rise of 0.5% a year ago. Most of the upward contribution came from accommodation services, where prices rose by 2.2% in the month, compared with a smaller increase of 1.0% a year earlier. Prices in restaurants and cafes also rose by more than a year ago, with the upward contributions coming from fast food, takeaways, and pub meals.
Clothing and footwear
Prices for clothing and footwear items fell by 1.5% between June and July 2022, compared with a larger fall of 2.0% in the previous year. Prices have risen by 6.6% in the year compared with an increase of 6.1% in the year to June.
The upward movements came from garments, in particular women's clothing, infant's clothing and women's footwear. There was a partially offsetting downward contribution from menswear, where prices overall fell, between June and July 2022, by more than a year ago.
Transport
Although the transport division only made a small upward contribution to change, there were substantial offsetting contributions at the group level.
The annual increase for transport was 15.1% in July 2022, down from 15.2 in June. Over the past two years, the annual rate has risen from minus 1.5% in June 2020 (during the first coronavirus (COVID-19) lockdown) to the latest figure for July 2022.
Note
The above extracts are from todays report by the ONS. Read the full report at https://www.ons.gov.uk/economy/inflationandpriceindices/bulletins/consumerpriceinflation/july2022