Consumer Price Inflation, UK: August 2022 - Inflation Dips To 9.9% - Prices Up Again
14th September 2022
Main points
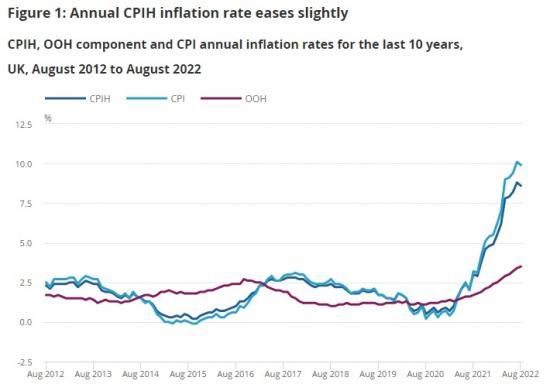
The Consumer Prices Index including owner occupiers' housing costs (CPIH) rose by 8.6% in the 12 months to August 2022, down from 8.8% in July.
The largest upward contributions to the annual CPIH inflation rate in August 2022 came from housing and household services (principally from electricity, gas and other fuels, and owner occupiers' housing costs), transport (principally motor fuels), and food and non-alcoholic beverages.
On a monthly basis, CPIH rose by 0.5% in August 2022, compared with a rise of 0.6% in August 2021.
The Consumer Prices Index (CPI) rose by 9.9% in the 12 months to August 2022, down from 10.1% in July.
On a monthly basis, CPI rose by 0.5% in August 2022, compared with a rise of 0.7% in August 2021.
A fall in the price of motor fuels made the largest downward contribution to the change in both the CPIH and CPI annual inflation rates between July and August 2022.
Rising food prices made the largest, partially offsetting, upward contribution to the change in the rates.
The Consumer Prices Index including owner occupiers' housing costs (CPIH) rose by 8.6% in the 12 months to August 2022, down from 8.8% in July, and despite a 0.5% rise in the month to August 2022.
The annual rate was below 1.2% from April 2020, at the start of the first coronavirus (COVID-19) lockdown, to March 2021. It then rose markedly to July 2022 before easing slightly in August 2022. The July 2022 figure was the highest recorded annual inflation rate in the National Statistic series, which began in January 2006. The rate was last higher in the constructed historical estimates in December 1990, when it stood at 9.2%.
The largest contributions to the annual rate in August 2022 are from housing and household services, transport, and food and non-alcoholic beverages. Their effects are shown in Figure 6 in Section 4.
The Consumer Prices Index (CPI) rose by 9.9% in the 12 months to August 2022, down from 10.1% in July. Similar to the CPIH, the rate had risen sharply over recent months before easing in August.
The July figure was the highest annual CPI inflation rate in the National Statistic series, which began in January 1997. Indicative modelled consumer price inflation estimates suggest that the CPI rate would last have been higher around 1982, where estimates range from nearly 11% in January down to approximately 6.5% in December. The main contributors to the August 2022 rate are shown in Figure 10 in Section 5.
On a monthly basis, CPIH rose by 0.5% in August 2022, compared with a rise of 0.6% in the same month a year earlier. The CPI monthly rate was also 0.5%, compared with 0.7% in August 2021.
Food and non-alcoholic beverages made the largest upward contribution to the monthly rates in August 2022, while falling prices for motor fuels resulted in a large offsetting downward contribution. In August 2021, the main upward contributions to the monthly rates came from transport, and recreation and culture.
Given that the owner occupiers' housing costs (OOH) component accounts for around 17% of the CPIH, it is the main driver for differences between the CPIH and CPI inflation rates. The inclusion of Council Tax and rates in CPIH is the only further difference in coverage. This makes CPIH our most comprehensive measure of inflation and, therefore, the figures in Section 3 and overall commentary in Section 4 in this bulletin focus on CPIH. While the coverage differs, the main drivers of the annual inflation rate are the same where they are common to both measures. Section 5 comments, mostly graphically, on the CPI.
Notable movements in prices
The easing in the annual inflation rate in August 2022 reflected principally a fall in the price of motor fuels in the transport part of the index. Smaller, partially offsetting, upward effects came from price rises for food and non-alcoholic beverages, miscellaneous goods and services, and clothing and footwear.
Transport
The annual inflation rate for transport was 12.4% in August 2022, down from 15.1% in July. The annual rate rose from minus 1.6% in May 2020 (during the first coronavirus (COVID-19) lockdown) to 15.2% in June 2022 before easing in the latest two months.
Motor fuel price changes are the main driver behind the overall movements within transport, with fuel prices increasing by 32.1% in the year to August 2022. Average petrol and diesel prices stood at 175.2 and 186.6 pence per litre, respectively, in August 2022, compared with 134.6 and 137.0 pence per litre a year earlier.
The annual rate for motor fuels eased from 43.7% to 32.1% between July and August 2022. This is principally a result of petrol prices falling by 14.3 pence per litre between these months. A year ago, petrol prices rose by 2.0 pence per litre between July and August 2021. Diesel prices also contributed to the change in the rate, falling by 11.3 pence per litre this year, compared with a 1.5 pence per litre rise a year ago.
Elsewhere in the transport division, second-hand car prices rose by 4.6% in the year to August 2022, down from 8.6% in July. The annual rate has eased for the fifth consecutive month since March 2022, when it was 31.0%. Although prices have fallen between March and August 2022, much of the change in the annual inflation rate is a base effect as prices rose by over 18% between March and August 2021. During that period, there were reports of increased demand, combined with restricted supply.
Food and non-alcoholic beverages
Food and non-alcoholic beverage prices rose by 13.1% in the 12 months to August 2022, up from 12.7% in July. The annual rate for this category was minus 0.6% in July 2021 but it has since risen for 13 consecutive months. The current rate is the highest since August 2008.
The increase in the annual rate between July and August 2022 was driven by price movements across many of the more detailed classes. The largest upward effect came from milk, cheese and eggs, where prices of milk and cheese rose between July and August 2022 by more than between the same two months a year ago.
Overall prices for food and non-alcoholic beverages have risen throughout 2022, and the 1.5% increase between July and August 2022 was the largest July to August rise since 1995, when a constructed series for food and non-alcoholic beverages showed a 1.6% increase.
Miscellaneous goods and services
The annual rate for the miscellaneous goods and services category was 4.6% in August 2022, up from 4.0% in July. The rate is the highest recorded since September 2005. This division contains such diverse goods and services as hairdressing, toiletries and cosmetics, jewellery, insurance, and financial services. The main driver behind the annual rate for the overall division, and the change in its annual rate between July and August 2022, came from appliances and products for personal care.
Clothing and footwear
The annual rate for clothing and footwear was 7.6% in the year to August 2022, up from 6.6% in July. Prices rose by 1.1% on the month in 2022, compared with a smaller rise of 0.2% in August 2021. Prices normally rise at this time of year as the autumn ranges enter the shops following the summer sales season. However, the coronavirus pandemic affected the standard seasonal pattern in 2021 (and 2020), and the 0.2% rise in 2021 was the lowest July to August movement since a 0.2% fall between July and August 1992 in the constructed historical series.
The increase in the annual rate between July and August 2022 came principally from men's and women's clothing, where prices rose between July and August 2022 but fell between the same two months a year ago.
Read the full report HERE