Producer Price Inflation UK January 2023 - Factory Gate Prices Up by 13.5%
15th February 2023
Producer input prices rose by 14.1% in the 12 months to January 2023, down from 16.2% in the year to December 2022.
Producer output (factory gate) prices rose by 13.5% in the 12 months to January 2023, down from 14.6% in the year to December 2022.
Inputs of crude oil, and petroleum products, provided the largest downward contributions to the change in the annual rates of input and output inflation, respectively.
On a monthly basis, producer input prices decreased by 0.1% and output prices increased by 0.5% in January 2023.
Producer price inflation rates
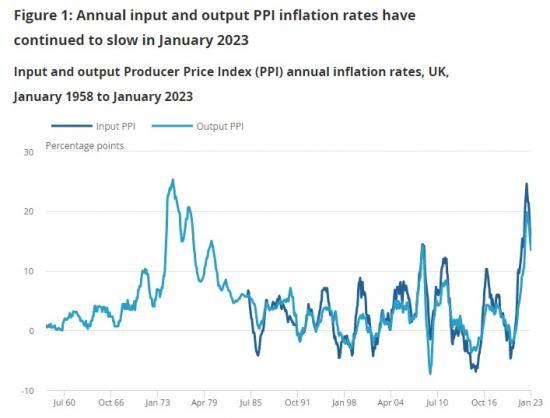
The annual rate of the input Producer Price Index (PPI) has now been positive for 26 consecutive months, although it has been slowing for the last seven months. The annual rate is now 10.5 percentage points below its record annual high of 24.6% in June 2022 (Figure 1).
The annual rate of the output PPI has now been positive for 25 consecutive months, and has been slowing for six consecutive months. It is down 6.3 percentage points from its recent peak of 19.8% in July 2022.
Input producer price inflation
Producer input prices fell by 0.1% in January 2023, compared with a decrease of 1.1% in December 2022 (Table 1). The monthly rate reached a record high of 5.1% in March 2022.
The largest upward contribution to the annual input inflation rate came from metals and non-metallic mineral products, which contributed 3.17 percentage points (Figure 3). This product group saw an increase in the year to January 2023 of 14.2% (Table 2). This is up from 13.6% in December 2022 as global steel prices and energy costs continue to affect the price of these materials.
The second largest contributor to the annual rate in January 2023 came from home food materials, which contributed 2.37 percentage points (Figure 3). Home food materials saw an increase in the year to January 2023 of 18.0%, up marginally from 17.8% in December 2022. Farming costs and energy prices continue to keep the price of home food materials high.
In the year to January 2023, the annual rate of producer input inflation was 14.1%, down 2.1 percentage points from 16.2% in December 2022.
Of the 10 product groups, 5 showed downward contributions to the change in the annual rate, with crude oil providing the largest, at 1.20 percentage points (Figure 4). Crude oil saw a monthly decrease of 8.7% in January 2023, compared with an increase of 10.3% in January 2022.
Food products provided the largest upward contribution to the output annual rate in the year to January 2023, at 4.09 percentage points (Figure 5). This was mainly driven by preserved meat and meat products. The annual inflation rate for food products was 17.1% in the year to January 2023 (Table 5), which is unchanged from December 2022.
The second largest contributor to the annual rate in the year to January 2023 came from other manufactured products, which contributed 2.63 percentage points (Figure 5) and showed an increase of 11.6% in the year to January 2023. This is up slightly from 11.5% in December 2022. The continued increase was mainly driven by articles of concrete, cement and plaster.
The annual rate of producer output inflation decreased by 1.1 percentage points from 14.6% in December 2022 to 13.5% in January 2023.
Of the 10 product groups, 7 show downward contributions to the change in the annual rate. Petroleum products provided the largest downward contribution to the change in the annual output rate, at 0.49 percentage points (Figure 6). Petroleum products saw a monthly decrease of 2.7% in price in January 2023, compared with an increase of 3.1% in January 2022.
Note
Read the full report HERE