Economic activity and social change in the UK, real-time indicators: 9 March 2023
9th March 2023
Spending indicators recorded increased activity when compared with the previous week, coinciding with usual within-month variations, with Revolut debit card spending on "travel and accommodation" rising by 6 percentage points; meanwhile the number of in-store transactions at Pret A Manger locations in both London airports and London stations increased by 7 percentage points over the same period (Revolut, Pret A Manger). Section 3: Consumer behaviour.
Approximately 7 in 10 (70%) businesses reported some form of concern for their business for March 2023, broadly stable with the proportion for February 2023 (72%); the top two concerns reported by businesses for March 2023 continued to be energy prices (19%) and inflation of goods and services prices (15%) (final results from Wave 77 of the Business Insights and Conditions Survey (BICS)).
The total number of online job adverts grew by 4% in the week to 3 March 2023, but was 20% lower than the equivalent period of 2022; with increases in 16 of the 28 job categories, and 10 of the 12 UK countries and English regions compared with the previous week (Adzuna). Section 4: Business and workforce.
Both the System Average Price of gas and System Price of electricity remained lower than the equivalent week of last year, at 63% and 48% lower, respectively; both prices remained above the pre-coronavirus baseline, however, at 419% above for the System Average Price of gas and 348% above for the System Price of electricity (National Gas Transmission, Elexon). Section 5: Energy.
Transport indicators have shown mixed changes to activity in the week to 5 March 2023, with the average number of daily ship visits to UK ports decreasing by 18%, while traffic camera activity for cars in London was unchanged in the week, and pedestrian and cyclist activity in London grew by 6% compared with the previous week (exactEarth, Transport for London). Section 6: Transport.
Consumer behaviour
Revolut spending on debit cards
Revolut debit card spending increased by 12 percentage points in the week to 5 March 2023 compared with the previous week, with all six reported categories seeing an increase in the level of spending from the previous week.
The category that saw the largest increase was "retail", with an increase of 26 percentage points, which is in line with seasonal trends. Spending on "food and drink" saw the second largest increase from the previous week, at an increase of 7 percentage points.
All categories were above the level of spending seen in the equivalent week of 2022, with spending on "retail" being 35 percentage points higher, followed by spending on "food and drink" and "travel and accommodation", at 32 and 30 percentage points higher, respectively. The week to 5 March 2023 is the fourth week in a row where no sector categories are below the pre-coronavirus (COVID-19) baseline, with spending on "retail" being 84 percentage points above the baseline. Our accompanying Revolut spending on debit cards dataset is available.
Transactions at Pret A Manger
The number of in-store transactions at Pret A Manger stores showed a mixed picture in the week to 2 March 2023, increasing in five of the location categories, remaining broadly unchanged in four and decreasing in one.
The largest increases were in London airports and London stations, with both locations seeing increases of 7 percentage points and they have largely trended upwards since the beginning of 2023. The largest decrease was in Regional town locations, which reported a fall of 12 percentage points. Our accompanying Transactions at Pret A Manger dataset is available.
Automotive fuel spending
In the week leading up to 26 February 2023, the estimated demand for fuel per transaction was 5 percentage points below the level of the previous week and was 17 percentage points below the level seen in the equivalent week of 2022.
Average fuel prices were broadly unchanged in the week to 26 February 2023 but were 15 percentage points below the level in the equivalent week of 2022. Total fuel sales decreased 13 percentage points from the previous week and were 87% of the level seen in the equivalent period last year. Our accompanying Automotive fuel spending dataset is available.
National retail footfall
National retail footfall figures are supplied by Springboard, a provider of data on customer activity. Overall retail footfall in the week to 5 March 2023 was broadly unchanged from the previous week and was at 108% of the level in the equivalent week of 2022. High street footfall was 111% of the level in the equivalent week of 2022, with shopping centre footfall at 107% and retail park footfall at 101% over the same period.
All categories were broadly flat in the latest week, with high street, shopping centre and retail park footfall at 97%, 99% and 102% of the level in the previous week, respectively.
Overall retail footfall remains below the level in the equivalent week of 2019, at 89%, with shopping centre footfall the furthest below at 84% of the level.
Of the 12 UK countries and English regions, retail footfall decreased in seven, increased in three and was unchanged in two in the week to 5 March 2023. Footfall fell the most in Wales to 91% of the level in the previous week, while the largest increase was in the South East where it was 103% of the level in the previous week. Footfall in all UK countries and regions was above the level in the equivalent week of 2022.
UK spending on debit and credit cards: weekly CHAPS-based indicator
In the week to 2 March 2023, the aggregate CHAPS-based indicator of credit and debit card purchases increased by 9 percentage points from the previous week and increased by 3 percentage points compared with the same week in 2022.
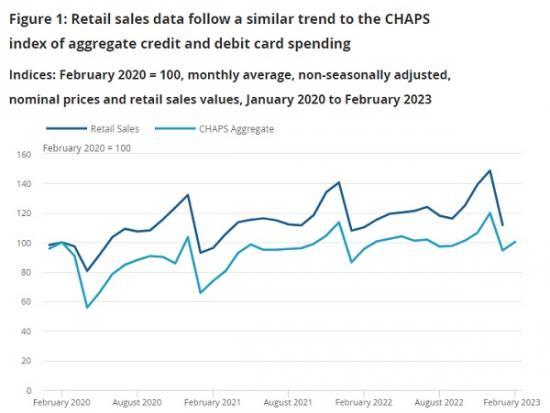
UK spending on debit and credit cards: monthly CHAPS-based indicator
The monthly data time series is available in our accompanying UK spending on credit and debit cards dataset and includes methodological notes that users should bear in mind. The monthly CHAPS index is calculated by the Office for National Statistics (ONS), rather than being an additional series that is produced and validated by the Bank of England.
The monthly CHAPS-based indicator of aggregate credit and debit card spending in February 2023 was 6 percentage points higher than in January 2023, in line with expected seasonal patterns. All spending categories increased from January 2023 to February 2023, with the largest increase reported in the "work-related" category, which was up 10 percentage points.
The monthly indicator in February 2023 was 5 percentage points higher than in February 2022. All categories except "delayable" increased compared with February 2022, with "work-related" spending seeing the largest increase of 12 percentage points, followed by "staple" increasing by 11 percentage points and "social" increasing by 3 percentage points. "Delayable" spending reduced by 2 percentage points when compared with February 2022. "Delayable" spending is the only category that is below the pre-coronavirus baseline, at 22 percentage points below.
The monthly CHAPS-based aggregate index can provide an indication of the direction of retail sales data, having followed similar trends since the CHAPS index was established in January 2020. The ONS publishes retail sales data around the middle of each month, approximately two weeks after the monthly CHAPS index is published in this bulletin.
Business and workforce
Online job adverts
The total number of online job adverts increased by 4% on 3 March 2023 compared with the previous week, with growth in 16 of the 28 job categories, falls in eight categories, and four remaining unchanged.
The "transport, logistics and warehouse" category saw the largest increase, rising by 52% in the latest week. Other large increases were seen in the "legal" and "marketing, advertising or public relations (PR)" categories, which rose by 22% and 21%, respectively. Because of an inconsistent data supply, the "transport, logistics and warehouse" and "marketing, advertising or PR" categories have shown higher levels of volatility over recent weeks and should be used with caution when comparing with other periods in the year.
The total number of online job adverts was 20% lower than the level seen in the equivalent period of 2022. Both "human resources (HR) and recruitment" and "creative, design or arts and media" saw the largest decreases relative to last year's levels, at 54% and 51% lower, respectively.
Online job adverts increased in 10 of the 12 UK countries and English regions compared with the previous week, with the largest increases seen in the South West and South East of England, both rising by 4%. Our accompanying Online job advert estimates dataset is available.
Advanced notification of potential redundancies
Calculated as a rolling four-week average, the number of potential redundancies reported in the week to 26 February 2023 was 67% above the level in the equivalent week of 2022, while the number of employers proposing redundancies was 65% above the level in the equivalent week of 2022. Our accompanying Advanced notification of potential redundancies dataset is available.
Read the full report HERE with links