The Average Price Of Wholesale Gas January 2020 To March 2023
9th March 2023
System Average Price (SAP) of gas
This is the average price of all gas traded through the balancing market. Market participants post bids or offers for volumes of gas a day ahead and within-day trades. The SAP aggregates the trades conducted on the On-the-Day Commodity Market (OCM). This is the market that the National Gas Transmission use in their role as residual balancer. Other markets exist for wholesale gas trading in Great Britain.
These data can be used to understand the general trend of gas prices within the UK. However, the data should be treated with caution, as these can be subject to extreme within-day trading prices and may skew actual traded prices. Additionally, while these prices reflect spot prices on the day, traders can opt for futures contracts where the buyer and the seller agree the market-determined price for gas for a future date. The daily SAP is used to determine the futures price and is therefore a useful indicator of supply constraints and demand pressures.
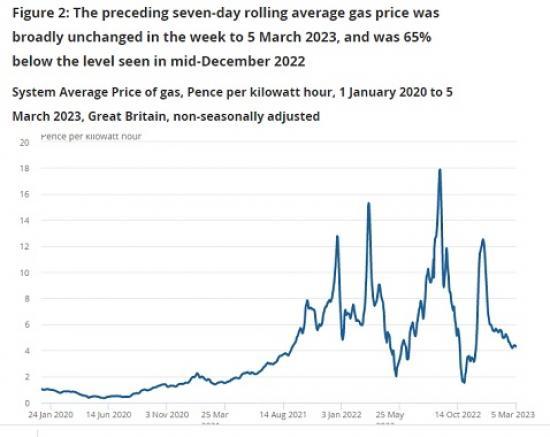
Figure 2: The preceding seven-day rolling average gas price was broadly unchanged in the week to 5 March 2023, and was 65% below the level seen in mid-December 2022
System Average Price of gas, Pence per kilowatt hour, 1 January 2020 to 5 March 2023, Great Britain, non-seasonally adjusted.
The System Average Price (SAP) of gas has generally trended downwards recently, being 63% lower than the level in the equivalent week of 2022 in the latest week and 74% lower than the peak in mid-August 2022. Our accompanying System Average Price of gas dataset is available.
Read the full ONS report HERE