Demand And Supply Factors In CPI Inflation UK - 2021 To 2022
9th March 2023
Insights into the effects of the re-opening of economies and supply bottlenecks on Consumer Prices Index (CPI) inflation in 2021 and 2022.
Consumer price inflation reached 40-year highs in late 2022, including the effects of the re-opening of economies in 2021 and bottlenecks forming in the global economy.
Food and energy price inflation explains around half of the 9% increase in consumer prices in 2022, but inflationary pressures have not only been confined to food and energy prices, as core inflation increased by its highest rate of price inflation since 1992.
Items affected by the re-opening of economies explains around a sixth of Consumer Prices Index (CPI) inflation in 2022, while items affected by supply bottlenecks explain a 10th; these goods and services have experienced higher inflation in 2022 than their historic trends.
Overview
Consumer price inflation was running at 40-year highs in the UK in late 2022, primarily reflecting the effects of higher tradable goods and energy prices. One cause of this was the re-opening of economies in 2021, including large changes in the level and composition of spending ("demand"), while another is that bottlenecks had formed in the global economy ("supply"). This led to some imbalances in product and labour markets, pushing up consumer price inflation. Energy prices also increased markedly in 2022, particularly gas prices, largely in response to the conflict in Ukraine.
One of the challenges has been in unpicking the underlying causes of this increase in consumer price inflation in the UK. We replicate recent research on Bottlenecks and monetary policy by the European Central Bank (ECB), where we look to classify those goods or services that have been particularly affected by the reopening of the economy or supply bottlenecks. This is carried out at the 85 Consumer Prices Index (CPI)-class level. We then track these contributions to show the impact of these items on headline UK CPI movements in recent years. This includes how these price movements compare with the more "normal" times of 2012 to 2019, where CPI inflation was at the 2% inflation target over this period. This provides some indication of the extent to which these inflationary pressures have built lately.
For the purposes of this research, we take these ECB classifications at face value which are then imposed on the UK. However, it is important to highlight that there are uncertainties in this exercise.
A product has been classified as being particularly affected by either the reopening of the economy or supply bottlenecks, which is kept the same throughout the period so we can track how these prices have evolved. However, reopening the economy and supply bottlenecks have had wide-ranging impacts on many products. Given the impacts of Brexit, the coronavirus (COVID-19) pandemic, and the recent energy price shock, the inflationary dynamics have likely been more complicated, including for these products.
The UK is experiencing a similar energy price shock to Europe, but the UK also has a tighter labour market. This might reflect the fall in labour supply in the UK, particularly given the effects of early retirement and long-term sickness on inactivity in the UK. As such, the ECB classifications might not fully reflect these supply bottlenecks in the UK.
The energy intensity of CPI reflects that there are also indirect effects of higher energy prices, which demonstrates how much energy is an intermediate input into their production. It might be that some of these items affected by the reopening of the economy or supply bottlenecks are also more energy intensive. Alternatively, it might be that some of these supply and demand effects have begun to fade, but indirect energy costs are now playing more of a role.
Despite the uncertainties, the transparency of this research provides some new insights into understanding better how these changes in demand and supply might have affected UK CPI inflation in recent years.
Increases in underlying core inflation and inflationary pressures
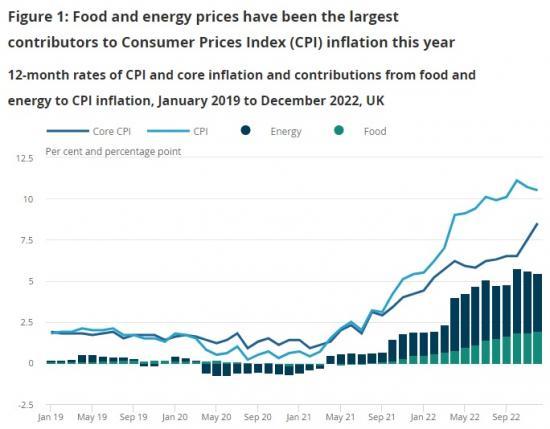
Food and energy have been the largest contributors to Consumer Prices Index (CPI) inflation over the last year, which have largely reflected the effects of the conflict in Ukraine on energy and commodity prices. Food inflation rose to 16.8% in the year to December 2022, while prices for household energy (gas, electricity, and other fuels) increased by 88.7% over the same period. The contributions of food and energy explain around half of headline consumer price inflation (Figure 1). This is in sharp contrast to the experience of the period of January 2012 to December 2019, where CPI inflation was around its 2% target.
However, inflationary pressures have not only been confined to food and energy prices, as there has been a broadening of some of these price increases. Core inflation is one proxy of the underlying rate of inflation in an economy, removing some of the more volatile price movements which typically contain less information about where inflation might be in the future. Figure 1 shows core inflation (which excludes energy, food, alcohol, and tobacco) increased by 8.5% in the 12 months to December 2022. This is its highest rate of price inflation since 1992, highlighting there are broader inflationary pressures in the economy.
Read the full ONS report HERE