Consumer Price Inflation UK March 2023 Rate 10.1% But Food 19.2% Highest Increase For 45 Years
19th April 2023
The Consumer Prices Index including owner occupiers' housing costs (CPIH) rose by 8.9% in the 12 months to March 2023, down from 9.2% in February.
The largest upward contributions to the annual CPIH inflation rate in March 2023 came from housing and household services (principally from electricity, gas and other fuels), and food and non-alcoholic beverages.
On a monthly basis, CPIH rose by 0.7% in March 2023, compared with a rise of 0.9% in March 2022.
The Consumer Prices Index (CPI) rose by 10.1% in the 12 months to March 2023, down from 10.4% in February.
On a monthly basis, CPI rose by 0.8% in March 2023, compared with a rise of 1.1% in March 2022.
The largest downward contributions to the monthly change in both the CPIH and CPI annual rates came from motor fuels, and housing and household services (particularly liquid fuels), partially offset by upward contributions from food, and recreation and culture.
Core CPIH (excluding energy, food, alcohol and tobacco) rose by 5.7% in the 12 months to March 2023, unchanged from February; the CPIH goods annual rate eased from 13.4% to 12.7% over the two months, while the CPIH services annual rate rose slightly from 5.6% to 5.7%.
Indicative modelled consumer price inflation estimates suggest that the October 2022 rate was the highest rate in over 40 years (the CPIH National Statistic series begins in January 2006). In more recent months, the CPIH annual rate has eased to below 9.2%, a rate that was previously recorded just over 30 years ago, between September and December 1990. The slowdown in the annual rate between February and March 2023 came as a result of prices rising by 0.7% on the month compared with a rise of 0.9% a year earlier.
The Consumer Prices Index (CPI) rose by 10.1% in the 12 months to March 2023, down from 10.4% in February and from a recent peak of 11.1% in October 2022. Our indicative modelled estimates of consumer price inflation suggest that the October 2022 peak was the highest annual inflation rate since 1981 (the CPI National Statistic series begins in January 1997). The easing in the CPI annual rate between February and March 2023 came as a result of prices rising by 0.8% on the month compared with a rise of 1.1% a year earlier.
The main drivers of the annual inflation rate for CPIH and CPI are the same where they are common to both measures. However, the owner occupiers' housing costs (OOH) component accounts for 16% of the CPIH and is the main driver for differences between the CPIH and CPI inflation rates.
Notable movements in price
The easing in the annual inflation rate in March 2023 mainly reflected price changes in the transport division, particularly for motor fuels. There were also downward effects from housing and household services, furniture and household goods, clothing and footwear, and restaurants and hotels. These were partially offset by upward effects coming from food and non-alcoholic beverages, and recreation and culture.
Transport
The annual inflation rate for transport slowed from 3.1% in February 2023 to 1.0% in March 2023, down for a ninth consecutive month from a recent peak of 15.2% in June 2022, and the lowest rate since 1.0% in November 2020. The rate was last lower in August 2020. The easing in the rate between February and March 2023 was caused by changes in the price of motor fuels.
Overall, motor fuel prices fell by 5.9% in the year to March 2023, compared with a rise of 4.6% in February. Average petrol and diesel prices stood at 146.8 and 166.5 pence per litre, respectively, in March 2023, compared with 160.2 and 170.5 pence per litre in March 2022. Petrol prices fell by 1.2 pence per litre between February and March 2023, compared with a rise of 12.6 pence per litre between the same two months a year ago after Russia invaded Ukraine in February 2022. Similarly, diesel prices fell by 3.0 pence per litre this year, compared with a rise of 18.8 pence per litre a year ago.
Partially offsetting the downward effect from motor fuels, there were smaller upward pushes between February and March 2023 from transport services and, to a lesser extent, second-hand cars. The annual rate for transport services rose from 7.8% to 9.8% between these months, with the upward effect coming from air and rail fares. Second-hand car prices fell by 4.5% in the year to March 2023, compared with a larger fall of 5.9% in the year to February.
Housing and household services
The annual inflation rate for housing, water, electricity, gas and other fuels was 11.6% in March 2023, down from 11.8% in February. The main driver behind the change was liquid fuels, with prices of heating oil falling by 6.7% between February and March this year, compared with a rise of 44.0% between the same two months a year ago.
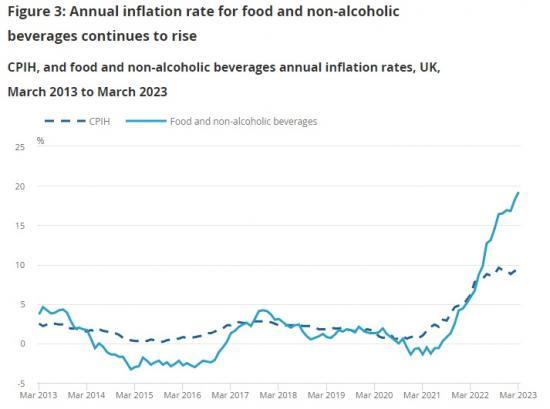
Food and non-alcoholic beverages
The slowing in the headline rate was partially offset by an upward effect from food and non-alcoholic beverages, where prices rose by 19.2% in the year to March 2023, up from 18.2% in February. The annual rate for this category in March 2023 is the highest seen for over 45 years. Indicative modelled estimates suggest that the rate would have last been higher in August 1977, when it was estimated to be 21.9%.
The increase in the annual rate for food and non-alcoholic beverages between February and March 2023 was driven by price movements from 5 of the 11 detailed classes. The largest upward effect came from bread and cereals, where prices rose in the month to March 2023 but fell a year earlier, leading to an annual rate of 19.4% in the year to March 2023. This is the highest annual rate for bread and cereals on record (with the series starting in January 1989). Within this detailed class, the upward push between the latest two months came from a variety of biscuits and cakes.
Other smaller upward effects between February and March came from fruit, chocolate and confectionery, and meat, partly offset by a downward movement from oils and fats, where the annual rate slowed from 32.1% to 25.6%.
The annual rates in March 2023 for chocolate and confectionery, other food products (principally ready-meals and sauces) and hot beverages were each the highest on record (starting from January 1989).
Recreation and culture
Prices for recreational and cultural goods and services rose, overall, by 4.6% in the year to March 2023, up from 4.1% in February. The increase in the annual rate came from a wide range of the more detailed classes including data processing equipment and cultural services.
The upward pressures were partially offset by an easing in the annual rate from recording media (particularly CDs purchased over the internet), where prices fell by 6.3% in the year to March 2023 compared with a smaller fall of 2.8% in February. The movements in this class depend, in part, on the composition of bestseller charts. Short-term movements in the rate should therefore be interpreted with a degree of caution.
Note
To read the full report go HERE