Time Use In The UK - March 2023
9th July 2023
The Office for National Statistics looks at how people spend their time.
After sleep and rest, adults in the UK spent an average of 3 hours and 44 minutes each day on entertainment, socialising, and other free time activities in March 2023 (including 2 hours and 16 minutes watching television); this was less than the average of 4 hours and 30 minutes in March 2020.
Around 9 in 10 adults spent at least 10 minutes each day doing unpaid household work (92%) and engaging in entertainment, socialising, and free time activities (89%) in March 2023, while almost two-thirds (64%) spent at least 10 minutes a day travelling and one-quarter (25%) took part in exercise, sporting, or well-being activities.
Among adults who did some form of unpaid childcare (10.2 million, 20%) or adult care (1.7 million, 3%) as a main activity in March 2023, they spent a daily average of 2 hours and 15 minutes and 1 hour and 36 minutes doing these activities, respectively.
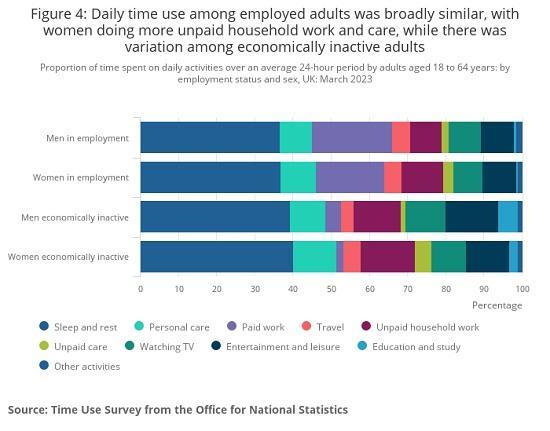
The pattern of time use over the average 24-hour day in March 2023 was broadly similar between employed men and women (though men spent more time doing paid work and women spent more time doing unpaid household work and care), but there was a lot of variation in time use among economically inactive adults according to the main reason for their inactivity and age.
Among working-age adults who were economically inactive because of retirement, after sleep and rest, on average most of their time was spent doing unpaid work (3 hours and 51 minutes), entertainment and leisure activities (3 hours and 16 minutes), and watching television (3 hours and 1 minute).
Economically inactive adults aged 50 to 64 years spent more time each day doing unpaid household work (4 hours and 2 minutes) and watching television (3 hours and 32 minutes) but less time travelling (46 minutes) than economically inactive adults aged 18 to 34 years (2 hours and 17 minutes, 1 hour and 12 minutes, and 1 hour and 19 minutes, respectively).
After sleep and rest (8 hours and 56 minutes), UK adults spent most of their time on entertainment, socialising, and other free time activities (3 hours and 44 minutes). This comprised mostly of watching television (2 hours and 16 minutes) and spending time with other people (33 minutes).
Across all adults, the least amount of time was spent on volunteering (3 minutes) and adult care (3 minutes). However, this changed considerably when looking at the average time spent on these activities by those who participated in them.
Among adults who volunteered as part of a group, organisation, charity or sports club, they did this for a daily average of 2 hours and 14 minutes. Similarly, among adults who spent time caring for other adults, the average daily time they spent doing this was 1 hour and 36 minutes.
Almost two-thirds of adults spent 10 minutes or more each day travelling (33.4 million, 64%) and around half of adults spent at least 10 minutes using a computer or digital device (26.7 million, 51%).
Among adults who did some form of childcare (10.2 million, 20%), they did this for an average of 2 hours and 15 minutes.
To understand how time was used across a typical 24-hour day in March 2023, Figure 3 shows the proportion of adults who were doing activities at different times during weekdays and weekends.
On weekdays, a large proportion of adults engaged in paid work during the daytime, and there are distinct periods in the afternoon and evening when people were doing personal care activities, including eating and drinking.
At weekends, the proportion of adults doing paid work was much smaller, and a greater proportion were spending time on unpaid household work and entertainment and leisure activities. The pattern of sleep during the weekend was also slightly different, with more adults waking later and going to sleep later.
Differences between men and women in employment
In February to April 2023, the employment rate for people aged 16 to 64 years was estimated to be 79.6% for men and 72.3% for women, compared with 79.0% and 72.3%, respectively in February to April 2022.
For further information on the estimated employment rate for males and females aged 16 to 64 years, see our Male employment rate (aged 16 to 64, seasonally adjusted) time series and our Female employment rate (aged 16 to 64, seasonally adjusted) time series.
The pattern of daily time among employed men and women of working age in March 2023 was broadly similar. Men spent more time on paid work than women (21%, 5 hours and 1 minute compared with 18%, 4 hours and 18 minutes, respectively). However, the amount of time women spent on average doing unpaid household work (10.9%, 2 hours and 37 minutes) was significantly higher than the amount of time spent by men doing unpaid household work (8.4%, 2 hours and 2 minutes).
Employed women also spent significantly more time on unpaid care (2.7%, 39 minutes) than employed men (1.8%, 26 minutes).
Read the full report HERE