Fiscal Risks And Sustainability - July 2023
15th July 2023
The following is merely a fraction of the full report linked at the foot of this page.
The Office for Budget Responsibility (OBR) was established in 2010 to examine and report on the sustainability of the public finances. A central feature of our efforts to meet that remit has been finding better ways to capture and communicate economic and fiscal risks. Ever since our first Economic and fiscal outlook (EFO) in 2010, we have emphasised the degree of uncertainty around our central forecasts by using probabilistic ranges (‘fan charts'), alternative scenarios, and sensitivity analysis. Our Fiscal sustainability reports (FSRs) that included long-term projections of the public finances also included sensitivity analysis to changes in key demographic, macroeconomic, and other assumptions. Between 2017 and 2021, we produced a biennial Fiscal risks report (FRR), setting out the main risks to the public finances, including macroeconomic and specific fiscal risks.
In the January 2022 update to the Charter for Budget Responsibility, Parliament amended the OBR's remit to, in effect, give us greater discretion to determine the content of our annual sustainability report, which had previously alternated each year between the long-term projections in the FSR and the focus on risks in the FRR. Last year, we published our first combined Fiscal risks and sustainability
report (FRS), which incorporated both our biennial long-term projections and updated analysis of major potential fiscal risks. As required under the Charter, the Treasury responded to this report alongside the March 2023 Budget.
In this, our second FRS, we focus on three specific risks: the rise in health-related inactivity in the labour market; the effect of higher gas prices on the demand for and supply of energy; and the effects of rising interest rates and high inflation on the UK's public debt. We have also updated our fiscal risks register, which we have amended to present risks across three high-level themes: shocks; policy risks; and long-term trends.
The analysis and projections in this report represent the collective view of the independent members of the OBR's Budget Responsibility Committee. We take full responsibility for the judgements that underpin the analysis and projections, and for the conclusions we have reached. We have been supported in this by the full-time staff of the OBR, to whom we are as usual enormously grateful.
We have also drawn on the help and expertise of officials across numerous government departments and agencies, including HM Treasury, the Bank of England, the Chief Medical Officer, the Climate Change Committee, the Debt Management Office, the Department for Energy Security and Net Zero, the Department of Health and Social Care, HM Revenue and Customs, the Department for Work and Pensions, the National Infrastructure Commission, NHS England, and the Office for National Statistics. We are very grateful for their insight.
In addition, we have benefited from discussions with experts from outside government. In particular, we would like to thank the Health Foundation, the Institute for Fiscal Studies, the International Monetary Fund, the Institute for Government, the Institute for Public Policy Research, the National Institute of Economic and Social Research, the Resolution Foundation, Professor Ben Baumberg Geiger at King's College London, Professor Clare Bambra at Newcastle University, Spencer Dale at BP, Jacob Nell from EDF Trading, Selma Mahfouz at the French General Inspectorate of Finance, Gene Frieda and colleagues at PIMCO, and students from U3A. We would also emphasise that despite the valuable assistance received, all judgements and interpretation underpinning the analysis and conclusions of the FRS are ours alone.
We provided the Treasury with a summary of our main conclusions on 23 June, and an updated version of these on 3 July. Given the importance of the report to the Treasury in managing fiscal sustainability and risks, we have engaged with Treasury officials throughout the process. We provided a full and final copy of this document once it was complete.
At no point in the process did we come under any pressure from Ministers, special advisers or officials to alter any of our analysis or conclusions.
We would be pleased to receive feedback on any aspect of the content or presentation of our analysis. This can be sent to feedback@obr.uk.
The Budget Responsibility Committee
Richard Hughes, Professor David Miles CBE and Andy King
Chapter 1: Executive summary
1.1 The 2020s are turning out to be a very risky era for the public finances. In just three years, they have been hit by the Covid pandemic in early 2020, the energy and cost-of-living crisis from mid-2021, and the sudden interest rate rises in 2022, whose consequences continue to unfold. This rapid succession of shocks has delivered the deepest recession in three centuries, the sharpest rise in energy prices since the 1970s, and the steepest sustained rise in borrowing costs since the 1990s. And they have pushed government borrowing to its highest level since the mid-1940s, the stock of government debt to its highest level since the early 1960s, and the cost of servicing that debt to its highest since the late 1980s.
1.2 From this more vulnerable position, governments face growing costs from an ageing society, a warming planet, and rising geopolitical tensions - challenges that no longer loom in the distance in our 50-year projections but pose significant fiscal risks in this decade:
as the ‘baby boom' cohorts enter retirement and high inflation ratchets up the cost of the triple lock, state pension spending is expected to be £23 billion in today’s terms (0.8 per cent of GDP) higher in 2027-28 than at the start of the decade;
as global temperatures rise and the 2050 deadline for reaching net zero draws closer, rising take-up of electric vehicles is expected to cost £13 billion a year in forgone fuel duty by 2030, while the public investments needed to support the decarbonisation of power, buildings, and industry could reach £17 billion a year by that date; and
in response to growing security threats in Europe and Asia, the Government has said it aspires to increase defence spending - for the first time in seven decades - from 2 to 2.5 per cent of GDP, at a potential cost of £13 billion a year in today’s terms.
1.3 In this second integrated Fiscal risks and sustainability report, we examine the aftershocks of three key risks that have crystallised since 2020 and consider their future fiscal implications:
Chapter 2 explores the drivers of, and prospects for, one of the most worrying post-pandemic trends, the rise in health-related inactivity among working-age adults;
Chapter 3 considers the impact of the rise in gas prices on energy demand and supply and the fiscal costs of meeting or missing the net zero emissions target in 2050;
Chapter 4 examines the vulnerability of current government debt levels, the impact of recent interest rate rises, and prospects for reducing debt over the medium term; and
Chapter 5 covers other risks in our fiscal risks register, how they have evolved since our last update in July 2021, and any mitigating actions the Government has taken.
Inactivity and health (Chapter 2)
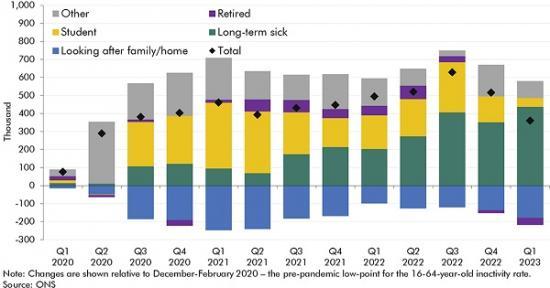
1.4 After rising to an all-time high in early 2020, working-age labour market participation has fallen in the aftermath of the pandemic. In the decade following the financial crisis, rising labour force participation was a bright spot in an otherwise disappointing decade for economic growth. Over the 2010s, the working-age employment rate rose from 70 to 77 per cent, making up for relatively meagre growth in productivity over this period. The pandemic saw a sudden and dramatic reversal of this trend, with the working-age inactivity rate rising by 1.5 percentage points to 21.7 per cent at its peak in mid-2022 and the number of people classed as inactive rising by almost 650,000. Today, working-age inactivity remains 350,000 above pre-pandemic levels, and the post-pandemic jump in inactivity seen in the UK was unusual compared to other advanced economies, which saw their working-age inactivity rates fall by an average of 0.4 percentage points between late 2019 and late 2022.
1.5 The largest and most durable source of this rise in inactivity has been among those citing ill-health as their principal reason for being out of the labour market. An influx of students into higher education and a spate of early retirements added 390,000 and 80,000 respectively to the ranks of the newly inactive at their peaks in 2021.
But by early 2023, these temporary surges had run their course, and the number of early retirees has fallen below pre-pandemic levels in recent months. By contrast, the number of people outside the workforce for health reasons has continued to rise. It reached 440,000 in the three months to April 2023, exceeding the net post-pandemic rise in inactivity of 350,000. As of early 2023, there were 2.6 million working-age people (6.1 per cent of the working-age population) outside the labour force for health reasons, making this group, for the first time, the single-largest segment of the economically inactive population.
1.6 This rise in health-related inactivity seems to be driven by the interplay of three main causal factors, some of which pre-date the pandemic:
a slowdown, and partial reversal, in the rate of improvement in the health of the working-age population over the past decade, reflecting both worsening trends in some specific health conditions - particularly mental health conditions - and an increase in the average age of the working-age population;
the impact of the pandemic on the health of the working-age population both as a direct result of Covid on people’s physical health, and due to the disruptive effects of the pandemic on people’s mental health and the treatment of non-Covid health conditions; and
rising onflows to health-related benefits, which may partly reflect the degree of ongoing assessment, conditionality, and return-to-work support for those on health-related benefits versus other out-of-work benefits, alongside the role of a sustained period of weak household income growth and rising cost-of-living pressures increasing the incentives to claim the former, more generous, benefits.
1.7 The increase in health-related inactivity has been concentrated among certain age groups, those with particular health conditions, those from lower socioeconomic groups, and those from certain types of prior employment. Specifically, the post-pandemic rise in health-related inactivity has been particularly pronounced among those who:
are older, with those aged 50 to 64 accounting for around half of the post-pandemic increase in health-related inactivity, despite accounting for less than a third of the working-age population;
are suffering from mental health problems or other unspecified conditions, which together account for around half of the total rise in health-related inactivity since the pandemic;
are relatively low skilled, with those with either no qualifications or qualifications at A-level and below accounting for three-quarters of the total long-term sick inactive population and nearly three-fifths of the increase in that population since the start of 2020, despite making up only half of the working-age population; and
have previously worked in lower-paid, customer-facing service industries and occupations,with the largest increases in health-related inactivity being among those who had previously worked in caring, leisure, and other services; sales and customer services; and elementary occupations (such as cleaners and hospital porters).
1.8 However, the vast majority of those currently inactive for health reasons have been out of work since before the pandemic. 1.5 million (62 per cent) of the working-age inactive population have been out of work for more than three years, and 560,000 (23 per cent) have never had a job. Only 100,000 (4 per cent) have been out of work for less than a year. Given that a person’s likelihood of returning to work declines rapidly the longer they are out of work - among those with health problems, an average of one-in-six people return to work each quarter in the first year after leaving, whereas only one-in-twenty do when they have been out of work a year or longer – this clearly presents a challenge for efforts to reverse this recent trend.
1.9 Only a relatively small proportion of those inactive for health reasons are on the NHS waiting list. The post-pandemic rise in health-related inactivity was accompanied by a steep rise in the number of waits for NHS treatments (with many people waiting for more than one) from 4.6 million in January 2020 to 7.4 million in May 2023. The coincident rise in these indicators suggests the possibility of a causal link, but we estimate that only 2.9 million working-age people were on the waiting list in 2022, of whom only around 650,000 were inactive due to long-term sickness (or a quarter of the long-term sick inactive population). While the disruption to and difficulties in accessing NHS services may have played a role in the worsening physical and mental health of the working-age population during this period, tackling the NHS waiting list alone is likely to make only a modest difference in the number of people out of work. We estimate that halving the NHS waiting list over five years – returning it to its mid-2015 level of around 3½ million – would only reduce working-age inactivity by around 25,000.
1.10 The large and growing number of people out of the workforce for health reasons or working with a health condition puts pressure on the public finances via three potential channels:
Higher welfare spending for those claiming health-related benefits. Over four-fifths of those inactive for health reasons, and more than 100 per cent of the change in this group over the past three years, are in receipt of incapacity benefits. With an average increase in universal credit awards of around £10,000 a year for this group, combined with rising disability benefit claims among both those in and out of work, the total increase in welfare spending associated with the 440,000 increase in health-related inactivity and 490,000 increase in ill-health among those in work is estimated to be around £6.8 billion in 2023-24.
Foregone tax revenue from people either not working, or working fewer hours and earning less. These fiscal costs are somewhat smaller than might be expected as the vast majority of those inactive for health reasons would have been likely to work in relatively low-wage occupations due to their lower qualifications. So the average income tax and NICs loss when employment falls and health-related inactivity rises – based on the evidence of the past three years – is estimated to be around £5,000 a year for each person, or £2.2 billion in total. Combined with lost income tax and NICs revenues as a result of rising ill-health within the working population (£3.0 billion) and indirect effects on other taxes (£3.7 billion), the total annual tax loss as a result of rising health-related inactivity and in-work ill-health over the past three years is likely to have risen to around £8.9 billion a year in 2023-24.
Higher health care spending, reflecting the two-way relationship between the duration of economic inactivity and deterioration in health. We estimate that each individual moving into health-related inactivity costs the NHS between £900 and £1,800 a year, as well as precipitating further costs in future given the well-documented negative effect of worklessness on people’s health.
1.11 Arresting and partially reversing the recent rise in health-related inactivity and in-work ill-health could significantly reduce a large and growing pressure on the public finances. Based on these estimates, we look at three scenarios for the future evolution of health-related inactivity:
The central forecast from our March 2023 Economic and fiscal outlook (EFO), in which working-age participation recovers from 78.6 per cent in 2022-23 to 79.3 per cent in 2027-28. In this forecast, borrowing falls from 2023-24 onwards, reaching £49.3 billion (1.7 per cent of GDP) by 2027-28, but debt (excluding the Bank of England) rises until 2026-27, before falling slightly to 94.6 per cent of GDP in 2027-28.
An upside scenario in which the pace of improvement in working-age participation returns to its pre-pandemic trajectory during the 2010s, with the rate rising to 80.5 per cent by 2027-28. This is driven by a 500,000 (20 per cent) reduction in health-related inactivity (and an equivalent decline in in-work ill-health) relative to our central forecast. Relative to our central forecast, this scenario reduces borrowing by £18.7 billion (0.6 per cent of GDP) by 2027-28, of which £6.5 billion comes from lower welfare spending, £10.9 billion from higher tax revenues, and £1.3 billion from lower debt interest spending. Debt falls from 2025-26 onwards, to reach 91.6 per cent of GDP in 2027-28.
A downside scenario in which working-age participation falls for another year to 78.2 per cent and then remains around that level until 2027-28. This scenario symmetrically sees 500,000 more people out of work for health reasons by 2027-28 relative to our central forecast. Relative to our central forecast, borrowing rises by £21.3 billion (0.8 per cent of GDP) by 2027-28, of which £7.6 billion comes from higher welfare spending, £10.9 billion from lower tax revenues, £1.3 billion from higher NHS pressures, and £1.5 billion from higher debt interest spending. The borrowing change is slightly larger than in our upside scenario due to the inclusion of higher NHS spending and some persistence in disability benefits spending when people move into work. Debt continues to rise reaching 98.0 per cent of GDP in 2027-28.
Read the full report HERE
This is a big report in detail has lots of charts.