Effects Of Taxes And Benefits On UK Household Income: Financial Year Ending 2022
18th July 2023
The redistribution effects of individuals and households of direct and indirect taxation and benefits received in cash or kind, analysed by household type.
Median household income in the UK before taxes and benefits was £35,000 in the financial year ending (FYE) 2022, increasing to £38,100 after taxes and benefits.
The richest fifth of people's average household income before taxes and benefits (£117,500) was 14 times larger than the poorest fifth (£8,200); however, this gap reduced to 4 times larger (£83,900 and £22,300, respectively) after taxes and benefits.
Original income inequality (before taxes and benefits) increased by 1.6 percentage points to 50.2% between FYE 2021 and FYE 2022, while final income inequality (after taxes and benefits) increased by only 0.6 percentage points to 29.9%, highlighting the redistributive effect of taxes and benefits.
Indirect taxes increased income inequality by 3.5 percentage points; the poorest fifth of people paid a greater proportion of equivalised disposable income on indirect taxes at 28.3%, compared with 9.0% for the richest fifth of people in FYE 2022.
The proportion of people living in households receiving more in benefits than they paid in taxes decreased from 55.0% to 53.8% in FYE 2022.
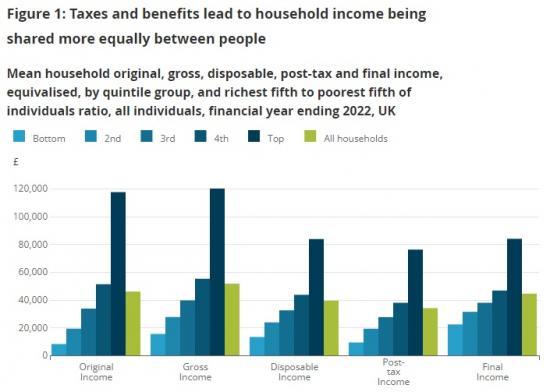
Taxes and benefits lead to income being shared more equally in financial year ending 2022
In the financial year ending (FYE) 2022, median household income in the UK before taxes and benefits was £35,000, increasing to £38,100 after taxes and benefits. The richest fifth had a mean household income before taxes and benefits of £117,500, over 14 times larger than the poorest fifth (£8,200). After cash benefits and direct taxes, this reduced to £83,700 for the richest fifth, 6.3 times larger than the poorest fifth (£13,200). After all taxes and benefits, this ratio reduced to 3.8 times larger, with average final incomes of £83,900 and £22,300 for richest and poorest people, respectively.
Indirect taxes increased income inequality in financial year ending 2022
Indirect tax is largely determined by household expenditure, and increased by 9.1% between FYE 2021 and 2022, in comparison with an increase of 4.8% in direct taxes. Main contributors to increased indirect taxes were Value Added Tax (VAT) and duties on hydrocarbon oils, consistent with annual increases in household expenditure as coronavirus (COVID-19) pandemic restrictions eased.
The richest fifth of people paid 1.9 times more in indirect taxes (£9,000) than the poorest fifth (£4,800) in FYE 2022. However, richer households pay a smaller proportion of their disposable income on indirect taxes (9.0%) than the poorest fifth (28.3%). As such, indirect taxes increased income inequality by 3.5 percentage points as measured by the Gini coefficient.
Household final income decreased in FYE 2022
After all taxes and benefits, there was a 2.1% decrease in median final income between FYE 2021 and FYE 2022, while mean final income remained relatively stable (0.2% decrease). This follows large increases in both mean (6.4%) and median (9.6%) household final income between FYE 2020 and FYE 2021.
The richest fifth of households saw an annual increase in mean final income of 2.1% in FYE 2022, while the poorest fifth saw little change (0.3% increase). However, over the 10-year period leading up to FYE 2022 (FYE 2013 to FYE 2022), mean household final income increased at a similar rate for both the poorest fifth (2.1% per year) and richest fifth of people (2.2% per year).
Read the full ONS Report HERE