Inflation Rate Reduces Slightly To 7.3% But No Comfort For Cost Of Living
19th July 2023
The Consumer Prices Index including owner occupiers' housing costs (CPIH) rose by 7.3% in the 12 months to June 2023, down from 7.9% in May.
On a monthly basis, CPIH rose by 0.2% in June 2023, compared with a rise of 0.7% in June 2022.
The Consumer Prices Index (CPI) rose by 7.9% in the 12 months to June 2023, down from 8.7% in May.
On a monthly basis, CPI rose by 0.1% in June 2023, compared with a rise of 0.8% in June 2022.
Falling prices for motor fuel led to the largest downward contribution to the monthly change in CPIH and CPI annual rates, while food prices rose in June 2023 but by less than in June 2022, also leading to an easing in the rates.
There were no large offsetting upward contributions to the change in the rate.
Core CPIH (excluding energy, food, alcohol and tobacco) rose by 6.4% in the 12 months to June 2023, down from 6.5% in May, which was the highest rate for over 30 years; the CPIH goods annual rate slowed from 9.7% to 8.5%, while the CPIH services annual rate was 6.3%, unchanged from May.
Core CPI (excluding energy, food, alcohol and tobacco) rose by 6.9% in the 12 months to June 2023, down from 7.1% in May, which was the highest rate since March 1992; the CPI goods annual rate slowed from 9.7% to 8.5%, while the CPI services annual rate eased from 7.4% to 7.2%.
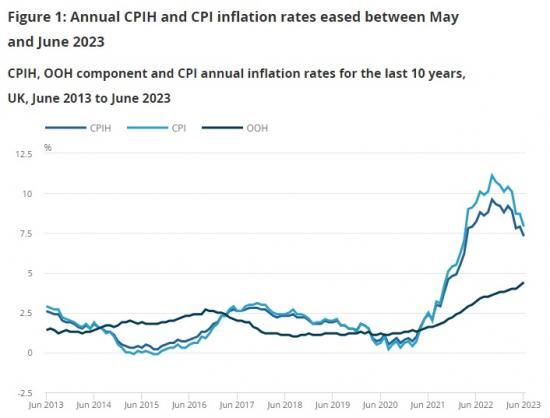
The Consumer Prices Index including owner occupiers' housing costs (CPIH) rose by 7.3% in the 12 months to June 2023, down from 7.9% in May, and down from a recent peak of 9.6% in October 2022. Our Indicative modelled consumer price inflation estimates suggest that the October 2022 rate was the highest in over 40 years (the CPIH National Statistic series begins in January 2006). The rate in June 2023 was the lowest since March 2022.
The slowdown in the annual rate between May and June 2023 was a result of prices rising by 0.2% on the month compared with a rise of 0.7% a year earlier.
The Consumer Prices Index (CPI) rose by 7.9% in the 12 months to June 2023, down from 8.7% in May, and down from a recent peak of 11.1% in October 2022. Our indicative modelled consumer price inflation estimates suggest that the October 2022 peak was the highest annual inflation rate since 1981 (the CPI National Statistic series begins in January 1997). The rate in June 2023 was the lowest since March 2022.
The easing in the CPI annual rate between May and June 2023 was a result of prices rising by 0.1% on the month compared with a rise of 0.8% a year earlier.
The main drivers of the annual inflation rate for CPIH and CPI are the same where they are common to both measures. However, the owner occupiers' housing costs (OOH) component accounts for 16.0% of the CPIH and is the main driver for differences between the CPIH and CPI inflation rates. This makes CPIH our most comprehensive measure of inflation. We cover this in more detail in Section 4: Latest movements in CPIH inflation of this bulletin, and provide a commentary on the CPI in Section 5: Latest movements in CPI inflation. We also cover both CPIH and CPI in Section 3: Notable movements in prices, though the figures reflect CPIH.
Notable movements in prices
The easing in the annual inflation rates in June 2023 principally reflected price changes in the transport division, particularly for motor fuels. There were also notable downward effects from food and non-alcoholic beverages, furniture and household goods, and restaurants and hotels. There were no large offsetting upward effects.
Transport
Overall prices in the transport division fell by 1.7% in the year to June 2023, compared with a rise of 1.3% in May. This continues the broadly downward trend in the annual rate since June 2022 and it is the first time that the rate has turned negative since August 2020. Prices fell by 0.7% between May and June this year, compared with a rise of 2.4% between the same two months a year ago.
The easing in the annual rate for transport was almost entirely because of changes in the price of motor fuels.
Overall, motor fuel prices fell by 22.7% in the year to June 2023, compared with a fall of 13.1% in May. Average petrol and diesel prices stood at 143.0 and 145.7 pence per litre respectively in June 2023, compared with 184.0 and 192.4 pence per litre in June 2022. Petrol prices fell by 1.4 pence per litre between May and June 2023, compared with a rise of 18.1 pence per litre between the same two months a year ago. Similarly, diesel prices fell by 8.9 pence per litre this year, compared with a rise of 12.7 pence per litre a year ago.
Food and non-alcoholic beverages
Food and non-alcoholic beverage prices rose by 0.4% between May and June 2023, compared with a rise of 1.2% between the same two months a year ago. This resulted in an easing in the annual rate to 17.4% in June 2023. This is down from 18.4% in May 2023 and from a recent high of 19.2% in March 2023, which was the highest annual rate seen for over 45 years.
The slowing in the annual rate for food and non-alcoholic beverages between May and June 2023 was driven by relatively small price movements from 7 of the 11 detailed classes. The largest downward contribution came from the milk, cheese and eggs category, with the annual rate easing to 22.8%, from 27.4% in May. There were other, smaller downward effects from meat (mostly from pork products), and bread and cereals.
Two small, partially offsetting upward effects came from sugar, jam, syrups, chocolate and confectionery (particularly chocolate), and mineral waters, soft drinks and juices.
Furniture and household goods
Prices of furniture and household goods were little changed between May and June this year, but they rose by 0.9% between the same two months a year ago. This resulted in an annual inflation rate of 6.6% in June 2023, down from 7.5% in May, and the lowest rate recorded since November 2021.
The easing in the annual rate principally reflected a downward effect from furniture and furnishings, where prices rose between May and June 2023, but by less than between the same two months in 2022. Within this category, there were small downward effects from a wide range of lounge, bedroom, kitchen and dining room furniture.
Restaurants and hotels
The annual inflation rate for restaurants and hotels was 9.5% in June 2023, down from 10.3% in May. On a monthly basis, prices rose by 0.5% between May and June 2023 compared with 1.2% between the same two months in 2022. The main driver behind the easing in the rate came from accommodation services, where prices rose by 11.3% in the year to June 2023, down from 14.4% in May.
Figure 5 shows the annual inflation rates for the Consumer Prices Index including owner occupiers' housing costs (CPIH) all goods, and all services series, together with CPIH excluding energy, food, alcohol and tobacco (often referred to as core CPIH). The CPIH inflation rate is added for comparison.
The core CPIH annual inflation rate was 6.4% in June 2023. This is down from 6.5% in May 2023, which was the highest rate since November 1991, when it was also 6.5%.
Owner occupiers' housing costs (OOH) rose by 4.4% in the 12 months to June 2023, up from an annual rate of 4.2% last month and 3.2% a year ago. This is the highest annual rate in OOH since November 1996.
The CPIH all goods index rose by 8.5% in the 12 months to June 2023, down from 9.7% in May. The slowing in the rate has been caused by a downward contribution to the change from energy, where prices rose by 2.9% in the year to June 2023, down from 8.1% in the year to May. There were other smaller downward effects from non-energy industrial goods (particularly housing goods) and food, alcoholic beverages and tobacco (particularly non-processed food).
The CPIH all services index rose by 6.3% in the 12 months to June 2023, unchanged from May. These rates are the highest since July 1992.
Figure 6 shows how each of the main groups of goods and services contributed to the change in the annual CPIH inflation rate between May and June 2023. To understand what has changed the inflation rate between these months, we can look at the differences between the contributions each of the 12 divisions made to the rate in May 2023 and the rate in June 2023. These differences sum to the change in the annual CPIH rate between the latest two months, that is, the easing from 7.9% to 7.3%.
The slowing in the rate into June 2023 was driven by downward contributions from five divisions, partially offset by small upward contributions from two divisions. These were led by a large downward contribution from transport, where prices of motor fuels fell by 2.7% between May and June this year, but rose by 9.3% between the same two months a year earlier.
Figure 7 shows the extent to which the distinct categories of goods and services have contributed to the overall annual CPIH inflation rate over the last two years. The contribution of each category to the annual rate depends on both the price movement in that category as well as its weight. Contributions help to explain what is driving the inflation rate by expressing it as the additive sum of its parts. For any one month, when added together, the contributions from the 12 divisions sum to the overall CPIH inflation rate, for example, 7.3% in June 2023.
The largest upward contributions to the annual CPIH inflation rate in June 2023 came from housing and household services (principally from electricity, gas and other fuels, and owner occupiers' housing costs), and food and non-alcoholic beverages. The contribution from the former group was 2.27 percentage points, marginally down from 2.28 percentage points in May, and down from a recent high of 3.70 percentage points in January this year. The contribution from the latter group has eased for a third successive month.
Although smaller, the contributions to the annual rate in June 2023 from communication, and health were each the largest or joint largest from those divisions since the start of the National Statistics series in 2006.
The contribution from transport turned negative in June 2023, the first negative contribution from the division since August 2020.
The Consumer Prices Index (CPI) differs from the CPIH in that it does not include owner occupiers' housing costs (OOH) and Council Tax. Figure 8 shows the contribution of these components to the annual CPIH inflation rate in the context of wider housing-related costs. In June 2023, the contribution of housing and household services in total to the annual CPIH inflation rate was 2.27 percentage points, down slightly from 2.28 percentage points in May.
The relatively high contribution to the rate since April 2022 came mainly from electricity, gas, and other fuels. The contribution from this group reflects price rises for gas and electricity in April and October 2022, following increases in the Office of Gas and Electricity Markets (Ofgem) cap on energy prices, offset partly by the government's Energy Price Guarantee (EPG). The subsequent easing in the contribution between March and April 2023 resulted principally from the price of electricity and gas falling slightly between these months in 2023 but rising sharply in 2022.
OOH's contribution to the CPIH annual inflation rate rose from 0.69 to 0.72 percentage points between May and June 2023. Costs rose by 0.5% in the month to June 2023, compared with a smaller rise of 0.3% in the same month a year earlier.
There was also a 0.36 percentage point contribution from actual rentals in June 2023, down slightly from 0.37 percentage points a month earlier. The contribution to the annual rate from Council Tax was 0.14 percentage points in June 2023, unchanged from May.
Read the full ONS Report HERE