Consumer Price Inflation, UK - January 2024 - No change from December Still 4%
14th February 2024
The Consumer Prices Index including owner occupiers' housing costs (CPIH) rose by 4.2% in the 12 months to January 2024, the same rate as in December 2023.
On a monthly basis, CPIH fell by 0.4% in January 2024, the same rate as in January 2023.
The Consumer Prices Index (CPI) rose by 4.0% in the 12 months to January 2024, the same rate as in December 2023.
On a monthly basis, CPI fell by 0.6% in January 2024, the same rate as in January 2023.
The largest upward contribution to the monthly change in both CPIH and CPI annual rates came from housing and household services (principally higher gas and electricity charges), while the largest downward contribution came from furniture and household goods, and food and non-alcoholic beverages.
Core CPIH (excluding energy, food, alcohol and tobacco) rose by 5.1% in the 12 months to January 2024, down from 5.2% in December 2023; the CPIH goods annual rate slowed from 1.9% to 1.8%, while the CPIH services annual rate rose from 6.0% to 6.1%.
Core CPI (excluding energy, food, alcohol and tobacco) rose by 5.1% in the 12 months to January 2024, the same rate as in December 2023; the CPI goods annual rate slowed from 1.9% to 1.8%, while the CPI services annual rate increased from 6.4% to 6.5%.
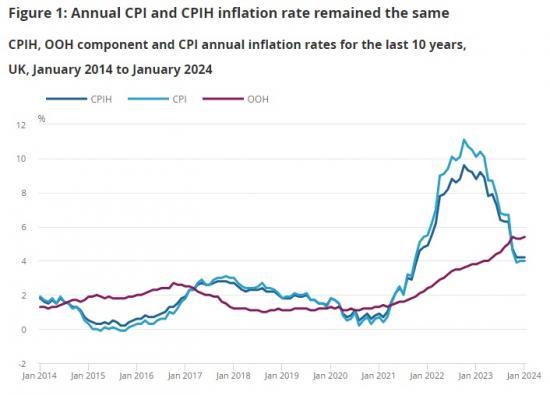
The Consumer Prices Index including owner occupiers' housing costs (CPIH) rose by 4.2% in the 12 months to January 2024, the same rate as in December 2023, and down from a recent peak of 9.6% in October 2022.
Our indicative modelled consumer price inflation estimates suggest that the October 2022 inflation rate was the highest in over 40 years (the CPIH National Statistic series begins in January 2006). The annual rate in December 2023 was the joint lowest since October 2021.
The unchanged annual rate between December 2023 and January 2024 was a result of prices falling by 0.4% on the month, the same rate as it was between December and January a year earlier.
The owner occupiers' housing costs (OOH) component of CPIH rose by 5.4% in the 12 months to January 2024, up from 5.3% in December 2023. OOH costs rose by 0.4% on the month, the same rate as it was between December and January a year earlier.
The Consumer Prices Index (CPI) rose by 4.0% in the 12 months to January 2024, the same rate as in December 2023, and down from a recent peak of 11.1% in October 2022. Our indicative modelled consumer price inflation estimates suggest that the October 2022 peak was the highest rate in over 40 years (the CPI National Statistic series begins in January 1997).
The unchanged annual rate between December 2023 and January 2024 was a result of prices falling by 0.6% on the month, the same rate as it was between December and January a year earlier.
The main drivers of the annual inflation rate for CPIH and CPI are the same in the majority of cases where they are common to both measures. However, the OOH component accounts for roughly 16% of the CPIH, and is the main driver for differences between the CPIH and CPI inflation rates. This makes CPIH our most comprehensive measure of inflation. We cover this in more detail in Section 4: Latest movements in CPIH inflation, and provide a commentary on the CPI in Section 5: Latest movements in CPI inflation. We also cover both CPIH and CPI in Section 3: Notable movements in prices, though the figures reflect CPIH.
Furniture and household goods
Prices in the furniture and household goods division rose by 0.5% in the year to January 2024, compared with a rise of 2.5% in the year to December 2023. Prices fell by 3.1% between December 2023 and January 2024, compared with a fall of 1.1% between the same two months a year ago.
The decrease in the annual rate was mainly the result of downward effects from furniture and furnishings, where prices fell by 5.2% on the month, the largest monthly fall since January 2020. Some of the items that contributed larger downward effects were kitchen base and wall units, leather settees, and dining tables and chairs.
Carpets and other floor coverings also provided a downward contribution because of the effect from tufted carpets and from floor rugs. Other items in this division that provided significant downward contributions were vacuum cleaners, fridge freezers, cleaning and maintenance products, and small tool accessories.
Food and non-alcoholic beverages
The annual rate of food and non-alcoholic beverages has fallen from 8.0% in December 2023 to 7.0% in January 2024, which is the lowest annual rate since April 2022. The fall to 7.0% means the annual rate has eased for the 10th consecutive month, from a recent high of 19.2% in March 2023, which was the highest annual rate seen for over 45 years.
Monthly prices for food and non-alcoholic beverage fell by 0.4% between December 2023 and January 2024, compared with a rise of 0.6% a year ago. Monthly prices for food (excluding non-alcoholic beverages) also fell by 0.4%. This was the first fall in monthly prices since September 2021, and the largest fall since July 2021.
The easing in the annual rate for food and non-alcoholic beverages was driven by "bread and cereals", where prices fell by 1.3% on the month, compared with a rise of 0.2% a year ago. The monthly fall was the largest since May 2021; some of the items providing larger negative contributions in this class were cream crackers, sponge cake, and chocolate biscuits.
Although the "bread and cereals" class provided the largest negative contribution, the slowing in the annual rate was fairly widespread across the division. Of the 11 classes, 7 provided a downward contribution, while the others were unchanged. The items that provided larger negative contributions include potato crisps, cooking sauces, and instant coffee.
Although the annual inflation rate for food has been slowing, food prices are still high following relatively sharp rises over the latest two years. The overall price of food and non-alcoholic beverages rose by around 25% over the two years between January 2022 and January 2024. This compares with a rise of around 10% over the preceding 10 years.
Housing and household services
The annual inflation rate for housing, water, electricity, gas, and other fuels was 2.5% in January 2024, up from 1.9% in December 2023. The main upward contribution came from gas, which rose by 6.8% on the month compared to a monthly rise of 0.3% last year. This led to the annual rate of gas falling by 26.5% in January 2024 compared with a fall of 31.0% in December 2023.
There was also a strong upward contribution from electricity, which rose by 4.0% on the month, compared with a monthly rise of 1.2% last year. This led to the annual rate of electricity falling by 13.0% in January 2023, compared with a fall of 15.4% in December 2023.
The rise in each category is largely because of the increase in the Office of Gas and Electricity Market (Ofgem) price cap in January 2024.
The price of electricity, gas, and other fuels in January 2024 is 18% lower than at its peak in January 2023. However, the price in January 2024 is 89% higher than it was in January 2021.
Transport
Prices in the transport division fell by 0.5% in the year to January 2024, compared with a fall of 1.3% in December 2023. Transport prices fell by 2.8% on the month to January 2024, compared with a monthly fall of 3.6% a year ago.
The reduction in the pace of decline in the annual rate was mainly the result of second-hand cars, with motor fuels also providing a strong upward contribution. However, these were partly offset by a strong downward contribution from air fares.
Prices of second-hand cars rose by 1.5% between December 2023 and January 2024, compared with a fall of 1.2% between the same two months last year. This was the first monthly rise in second-hand car prices since May 2023. The fall in the annual rate of 5.9% in January 2024 is a reduction in the pace of decline from the 8.4% fall in the year to December 2023.
The average price of petrol fell by 2.9 pence per litre between December 2023 and January 2024, to stand at 139.9 pence per litre, down from 149.4 pence per litre in January 2023. Diesel prices fell by 3.1 pence per litre this year, to stand at 148.3 pence per litre, down from 172.1 pence per litre in January 2023.
These movements resulted in overall motor fuel prices falling by 9.2% in the year to January 2024, compared with a fall of 10.8% in the year to December 2023.
Air fares fell as usual between December 2023 and January 2024, falling by 38.9%, compared with 41.7% a year ago. However, because the weight for this subclass increased between 2023 and 2024, this amplified the impact of the January 2024 monthly movement on the headline, resulting in a negative contribution to the change in annual consumer price inflation. The annual rate for air fares was 5.8% in January 2024, up from 0.8% in December 2023.
Read the full ONS report HERE