UK Trade In Goods, Year In Review - 2023
4th March 2024
The value of total goods imports decreased by £52.2 billion (8.2%) in 2023 compared with 2022, and total goods exports fell by £17.4 billion (4.4%), primarily because of falling imports and exports of fuels.
After adjusting for inflation, the total imports of goods decreased by £37.8 billion (7.4%) in 2023 compared with 2022, while total goods exports fell by £15.2 billion (4.6%).
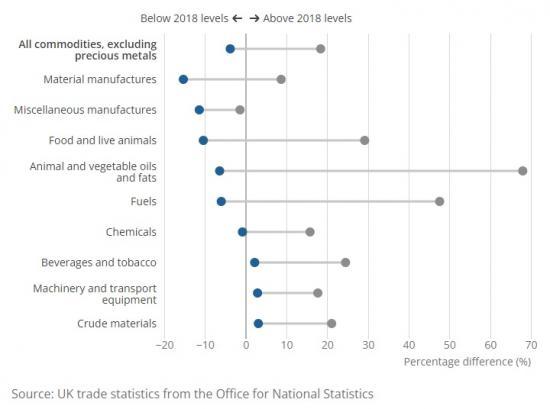
Imports and exports have increased in value terms since 2018, however, recent volatile price inflation has had a substantial impact on trade; after adjusting for inflation, the UK imported and exported less in 2023 than in 2018.
The value of fuel imports and exports fell in 2023, because of falling gas and oil prices; although prices were lower than in 2022, levels remain high and continue to affect other commodities.
There was a large difference between imports of food and live animals in value and inflation-adjusted terms, with the UK importing less in 2023 as costs increase.
Imports and exports of miscellaneous manufactures from non-EU countries have declined throughout 2023, with little difference in trends in value, and inflation-adjusted terms.
Trade in goods trends in 2023
Current prices
The value of total goods imports decreased by £52.2 billion (8.2%) in 2023 compared with 2022. However, goods imports increased by £90.3 billion (18.4%) when compared with 2018, our most recent "stable" period (Table 1), as explained in Section 9: Data sources and quality. Goods imports from the EU rose by £11.8 billion compared with 2022, but have remained relatively stable throughout the year, while imports from non-EU countries fell by £64.1 billion (Figure 1).
The value of total goods exports decreased by £17.4 billion (4.4%) when compared with 2022, however they increased by £23.7 billion (6.7%) when compared with 2018. Exports to both EU and non-EU countries fell throughout 2023, with EU exports falling by £11.5 billion and non-EU exports by £5.9 billion.
In value terms, the trade in goods balance was £205.3 billion in 2023, having narrowed by £34.8 billion compared with 2022, and widened by £66.6 billion compared with 2018.
Both imports and exports in value terms have fallen in 2023, largely because of decreases in imports and exports of fuels, following peaks in 2022. In our UK trade in goods, year in review: 2022 article, we noted that high fuel prices affected the pricing of other commodities, with increased transport and production costs contributing to rising prices across most commodities. In 2023, official estimates of producer price inflation fell, as reported in our Producer price inflation, UK bulletin, with prices stabilising from June onwards. UK trade has subsequently been much more stable in 2023 compared with 2022.
To consider the impact of prices on UK trade in goods in 2023, we compare the difference between current prices (CP) and chained volume measures (CVM) for imports and exports in this article (explained in Section 8: Glossary).
Chained volume measures
After removing the effect of inflation, total goods imports decreased by £37.8 billion (7.4%) in 2023 compared with 2022. This is a decrease of £18.9 billion (3.8%) when compared with 2018. Imports from both EU and non-EU countries fell over the year, with imports from non-EU countries decreasing by substantially more. The falls in imports in 2023 in inflation-adjusted terms were relatively modest compared with the decreases in value terms, highlighting that part of the decline was because of falling prices.
Total goods exports in 2023 fell by £15.2 billion (4.6%) compared with 2022, with substantial decreases in exports to both EU and non-EU countries. When compared with 2018, total goods exports fell by £44.7 billion (12.4%).
In inflation-adjusted terms, the trade in goods balance was £161.4 billion in 2023, having narrowed by £22.6 billion compared with 2022, and widened by £25.8 billion compared with 2018.
Trends in fuels
The value of fuel imports decreased by £36.7 billion (31.3%) in 2023 when compared with 2022 (Figure 4), because of a large fall in imports from non-EU countries. Over the same period, exports of fuels decreased by £24.3 billion (40.0%), primarily because of lower exports to the EU.
Compared with 2018, the value of fuel imports increased by £25.9 billion (47.6%), with increased imports from both EU and non-EU countries. Fuel exports fell by £4.8 billion (11.6%) over the same period, because of a large decrease in exports to non-EU countries.
The large decreases in both imports and exports of fuels in 2023 was linked to falling gas and oil prices. The price of gas decreased steadily over the first half of 2023, as reported in our System Average Price (SAP) of gas dataset, and stabilised at a much lower level than the peak of August 2022. Similarly, the price of crude oil was relatively stable throughout 2023, and lower than the peak observed in June 2022, as shown in the Brent crude oil summary on the Trading Economics website.
The large increases in fuel prices in 2022 were largely driven by the Russian invasion of Ukraine, which disrupted gas and oil trade. Although gas and oil prices fell in 2023 compared with 2022, the levels remain high.
When the effect of inflation is removed, the impact of volatile fuel prices is clear. Imports of fuels decreased by £0.4 billion (0.8%) in inflation-adjusted terms compared with 2022, and £3.1 billion (6.0%) compared with 2018. Fuel exports fell by £9.6 billion (26.9%) compared with 2022 and £13.9 billion (34.8%) compared with 2018.
High fuel prices had an effect on the pricing of other commodities in late 2022 and 2023, as logistic and transport costs rose, and increased the cost to trade for UK and global traders.
Trends in food and live animals
Imports of food and live animals increased by £3.5 billion (7.2%) in value terms in 2023 compared with 2022, because of a rise in imports from the EU (Figure 5). Over the same period, exports of food and live animals increased slightly by £0.8 billion (5.0%). However, imports of food and live animals increased by a greater £11.8 billion (29.2%) when compared with 2018, while exports grew by £2.2 billion (14.5%).
Imports of food and live animals has historically been a relatively stable series, with annual growth rates before 2022 averaging 2.9% between 2015 and 2021. However, there have been several changes that may have influenced trade in the commodity in recent years.
The UK Government introduced full customs controls from 1 January 2022 for all goods exported to and imported from the EU, with tariffs being applied to some products that originated from non-EU countries, as reported in The UK's new relationship with the EU policy paper on GOV.UK.
Separately, the Russian invasion of Ukraine created a substantial impact on the Ukrainian food trade. The subsequent rise in fuel prices also contributed to the increase in imports of food and live animals in value terms in 2022. Food prices have continued to grow in 2023, with UK food price inflation being among the highest across G7 economies in March 2023, as reported in our Food and energy price inflation, UK: 2023 article.
After removing the effect of inflation, imports of food and live animals decreased by £3.2 billion (8.0%) in 2023, with lower imports from both EU and non-EU countries. Meanwhile, exports fell by £0.6 billion (4.0%). Comparing with 2018, the decline in both imports and exports is more pronounced, with imports falling by £4.3 billion (10.4%), and exports falling by £1.1 billion (7.1%).
UK households have reported having to spend less on food, and eat out less, to compensate for the higher cost of living, as reported in our Impact of winter pressures on different population groups in Great Britain article. Food prices peaked in March 2023, as shown on our Cost of living insights: Food web page, and during the same period imports from the EU in inflation-adjusted terms hit their lowest point in 2023.
The difference between imports of food and live animals in current prices and chained volume measures is similar for both EU and non-EU countries. However, the effect appears larger for EU imports than for non-EU imports (Figure 5), as the UK imports a larger amount of food and live animals from EU countries. Food imports from both EU and non-EU countries have seen similar levels of price inflation, as shown in our Producer Price Inflation (PPI): imported EU food products time series and our PPI: non-EU imported food products time series.
Trends in miscellaneous manufactures
The value of miscellaneous manufactures imports decreased by £10.9 billion (13.0%) in 2023 compared with 2022, primarily because of falling imports from non-EU countries (Figure 6). Exports of miscellaneous manufactures increased slightly by £0.2 billion (0.6%) compared with 2022, with exports to the EU showing the greatest growth. Compared with 2018, imports of miscellaneous manufactures fell by £1.0 billion (1.4%), while exports fell by £4.8 billion (10.1%).
Although prices of miscellaneous manufactures have increased since 2022, the disparity between imports and exports in value and inflation-adjusted terms is less than it is with other commodities. After removing the effect of inflation, imports of miscellaneous manufactures fell by £12.3 billion (15.5%), and exports fell by £1.7 billion (4.4%) compared with 2022. When compared with 2018, imports fell by £8.6 billion (11.4%), while exports fell by £13.1 billion (26.7%).
The decrease in imports of miscellaneous manufactures from non-EU countries is partly the result of reduced imports of clothing, which fell by £4.7 billion (31.4%) compared with 2022, and £3.2 billion (23.6%) compared with 2018. The increased cost of living, and relatively high commodity costs, have likely reduced consumer demand in 2023, and contributed to the fall in imports. There was a continued decline in clothing retail sales, as reported in our Retail sales, Great Britain bulletin.
The decrease in exports of miscellaneous manufactures to the EU can mainly be attributed to falls in exports of clothing and footwear. Exports of clothing fell by £3.3 billion (61.6%) compared with 2018, while footwear exports decreased by £1.0 billion (66.9%).
In January 2022, tariffs were applied on exports to the EU for many clothing and textile products that were not wholly produced in the UK, as reported in The UK's new relationship with the EU policy paper on GOV.UK. The decrease in exports to the EU since January 2022 may be linked to increased tariffs or to the additional steps businesses have to make to avoid tariffs, as published in The UKFT Guide to Rules of Origin for Trading with the EU on the UKFT website.
[url=https://www.ons.gov.uk/economy/nationalaccounts/balanceofpayments/articles/uktradeingoodsyearinreview/2023]Read the full ONS report[ with much more data and links/url]