Recent Trends In UK Trade Volumes And Balances: 2010 To 2023
23rd April 2024
UK trade trends have been volatile over recent years following a range of overlapping economic and trade shocks.
UK export growth has become increasingly dominated by services since 2010, with goods exports increasing by just 7% in real terms, compared with services exports growing by 63% over the same period.
Most goods commodities have seen falls in exports but rises in imports since 2010; in contrast, most service types have seen an increase in both exports and imports.
Most goods commodities have seen falling exports to EU countries and increased exports to non-EU countries; however, most service types have seen higher exports to both the EU and non-EU countries.
The UK has consistently reported a trade deficit overall with EU countries and trade surpluses with non-EU countries.
Impacts on the UK economy
Developments in UK international trade flows have been an important interest for policymakers over recent years as a series of shocks have affected the UK economy. These include changing trade arrangements with the European Union, the local and global effects of the coronavirus (COVID-19) pandemic, global supply chain disruption, and a European energy crisis. More recently, there has been interest in the potential impacts of trade disruption in the Middle East. There have also been cyclical and structural changes in global trade flows in the period after the 2008 global financial crisis.
The impacts of these large economic shocks are complex. Our focus in this article is how trade flows have evolved in the period since the global financial crisis to better understand how the UK's external position with the rest of the world has changed. We focus on trade volumes (inflation-adjusted values), alongside values (current prices), as this shows how much the quantity of goods and services being traded has changed, without the distorting effects of recent high energy prices and inflation.
It should be noted that HM Revenue and Customs (HMRC) data collection changes following Brexit have affected statistics on UK trade in goods with the EU, resulting in a structural break from January 2021. Our Impact of trade in goods data collection changes on UK trade statistics articles provide more detail.
Recent trends in UK exports and imports
The total volume - or inflation-adjusted value - of UK exports has seen considerable volatility in recent years. This includes stockpiling effects in response to uncertainty around the UK leaving the European Union through 2019 (as shown in our Recent trends in the international trade flows of G7 economies article) and the effects of the coronavirus (COVID-19) pandemic in 2020 and 2021, as well as the structural break in data collection following Brexit.
We have compared the performance of goods and services exports over the last 14 years. Goods exports, excluding precious metals, have yet to return to their 2018 levels in real terms, and have been broadly flat in recent years. By contrast, services exports surpassed their pre-pandemic peak in late 2021 and have continued to grow.
Figure 1 shows how exports and imports of goods and services have evolved since 2010 in both current prices and chained volume measures (which adjusts values to account for inflation). In current prices, goods exports have increased by 48% over this period, while there has been a 7% increase in volume terms. In contrast, services exports have increased by 147% over these 14 years in current prices and by 63% in volume terms. This price effect has been particularly pronounced in recent years as inflationary pressure has driven current price measures of trade higher, relative to trade volumes. There are similar trends in the value and volume of UK imports. The value and volume of imports has grown more than exports for both goods and services since 2010.
Trade balances with the EU and the rest of the world
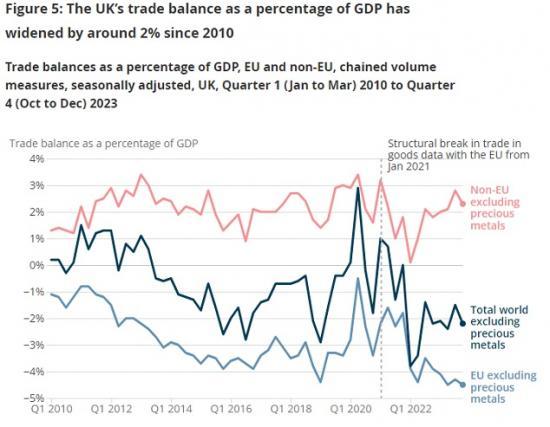
The trade balance shows the exports of goods and services net of the imports of goods and services. The UK's trade balance has widened from 0.2% of GDP in Quarter 1 (Jan to Mar) 2010 to negative 2.2% in Quarter 4 (Oct to Dec) 2023. However, this reflects a contrasting trade performance for EU and non-EU countries. The difference between the UK's trade balance with EU and with non-EU countries has widened over the period, albeit with considerable volatility during the coronavirus (COVID-19) pandemic period of 2020 and 2021. Recent volatility may also partly reflect data collection changes. The UK's EU trade deficit has fallen from negative 1.1% of GDP in Quarter 1 2010 to negative 4.5% in Quarter 4 2023. In contrast, the UK's non-EU trade surplus has risen from 1.3% of GDP in Quarter 1 2010 to 2.3% in Quarter 4 2023.
Read the full ONS report HERE