
GDP First Quarterly Estimate, UK - January To March 2024 - Increase 0.6% - Officially Out Of Recession
10th May 2024
UK gross domestic product (GDP) is estimated to have increased by 0.6% in Quarter 1 (Jan to Mar) 2024, following declines of 0.3% in Quarter 4 (Oct to Dec) and 0.1% in Quarter 3 (July to Sept) 2023.
Compared with the same quarter a year ago, GDP is estimated to have increased by 0.2% in Quarter 1 2024.
In output terms, services grew by 0.7% on the quarter with widespread growth across the sector; elsewhere the production sector grew by 0.8% while the construction sector fell by 0.9%.
In expenditure terms, there were increases in the volume of net trade, household spending and government spending, partially offset by falls in gross capital formation.
Compared with the same quarter a year ago, the implied GDP deflator rose by 4.0%.
Headline GDP figures
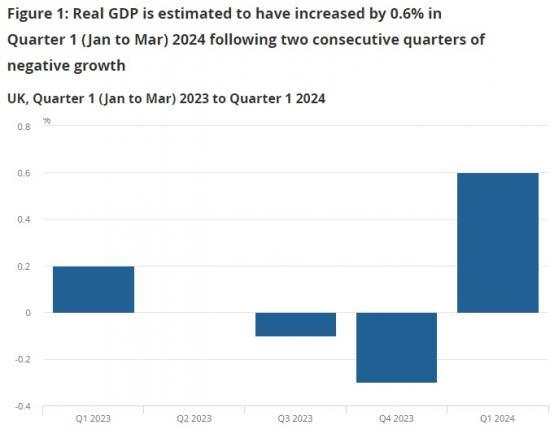
UK real gross domestic product (GDP) is estimated to have grown by 0.6% in Quarter 1 (Jan to Mar) 2024, following falls in the previous two quarters (Figure 1). Compared with the same quarter a year ago, real GDP is estimated to have increased by 0.2%.
Figure 1 shows that the economy has increased in the latest quarter following two consecutive quarters of negative growth. As explained in our Communicating the UK economic cycle methodology article, the concept of a "technical" recession comprises two or more consecutive quarters of contracting output. Most experts, as noted in our recent blog, consider other factors, while taking into account the latest data. For example, it is advisable to consider the broader picture such as the depth, diffusion (spread) and duration of the change in GDP.
It is also important to note that early estimates of GDP are subject to revision (positive or negative); for more information please refer to our GDP revisions in Blue Book: 2023 article. In the past, the absolute average revision between the first quarterly GDP estimate and the same quarterly estimate three years later is 0.2 percentage points when more detailed information is available through the comprehensive annual supply and use balancing process. The GDP growth vintages are shown in Table 5. In line with the National Accounts Revisions Policy, no periods are open to revision in this publication.
Our GDP monthly estimates bulletin published today (10 May 2024) show that GDP is estimated to have increased by 0.4% in March, following growth of 0.2% in February (revised up from 0.1% growth), and an unrevised increase of 0.3% in January 2024.
As well as producing estimates of GDP, the Office for National Statistics (ONS) also produces estimates of GDP per capita (or per head), which divides UK GDP by the total UK population. This is one proxy indicator of welfare, rather than production. As the UK population might not be changing at the same rate as GDP, this means that growth in GDP per capita can show a different trend to growth headline GDP.
Real GDP per head is estimated to have increased by 0.4% in Quarter 1 2024, following seven consecutive quarters without positive growth. It is estimated to be 0.7% lower compared with the same quarter a year ago. It is important to note that estimates of GDP per head up to 2021 are based on population estimates, whereas data for 2022 to 2024 are based on interim population projections. In our September quarterly national accounts, we will update our estimates of GDP per head for 2022 in line with the latest mid-year population estimates. Data for 2023 will be updated later in line with mid-year estimates, which are expected to be published in summer 2024.
Output
In Quarter 1 (Jan to Mar) 2024, output is estimated to have grown by 0.6%, following two consecutive falls of 0.1% in Quarter 3 (July to Sept) and 0.3% in Quarter 4 (Oct to Dec) 2023. The growth in the latest quarter was driven by a 0.7% increase in services output. Across Quarter 1, early estimates suggest 13 out of 20 of the subsectors grew, compared with 6 subsectors increasing in the previous quarter.
Services
Services output increased for the first time since Quarter 1 2023 after three consecutive quarters of decline. Services increased in all three months of the quarter: January (0.4%), February (0.3%) and March (0.5%), as explained in our monthly GDP release.
There was widespread growth in the services sector, with 11 out of 14 subsectors increasing in Quarter 1 2024, shown in Figure 3. The largest contributor to the growth in service output was a 3.7% increase in the transport and storage subsector. This was largely driven by growth of 6.4% in land transport services via pipelines (excluding rail transport). This industry saw its highest quarterly growth rate since Quarter 3 2020.
As published in our monthly GDP release, there was strong growth in February 2024 where Monthly Business Survey (MBS) data showed strength in the land transport services industry. A reclassification of a company into this industry, previously allocated in the wholesale trade excluding motor vehicles and motorcycles industry, also contributed to the strong growth.
Professional, scientific and technical activities increased 1.3% in the latest quarter and was the second-largest positive contributor. The growth in this subsector was driven mostly by legal activities, and scientific research and development.
Elsewhere there were falls in accommodation and food service activities (0.2%), and activities of households as employers; undifferentiated goods and services activities of households for own use (3.4%).
Overall, consumer-facing services grew by 0.6% in Quarter 1 2024, following a fall of 0.4% in Quarter 4 2023, and this was largely driven by Retail trade, except of motor vehicles and motorcycles. More information can be found in our Retail Sales publication. Additionally, anecdotal evidence from our UK spending on credit and debit cards dataset showed strong growth in credit and debit card spending on delayables at the start of 2024.
Production
The production sector is estimated to have increased by 0.8% in the latest quarter after a fall of 1.1% in Quarter 4 2023. This reflects a fall of 0.5% in January 2024 followed by growths of 1.0% and 0.2% in February and March, respectively. Further information is provided in our monthly GDP release.
Within production, manufacturing was the largest contributor with 8 out of the 13 manufacturing subsectors performing positively in the latest quarter, as shown in Figure 4.
Manufacturing output is estimated to have increased by 1.4% in Quarter 1 2024 following a fall of 1.0% in Quarter 4 2023. The largest positive contributor was a 5.7% increase in the manufacture of transport equipment, which has grown for six consecutive quarters. Manufacture of basic metals and metal products grew 3.1% and manufacture of food products, beverages and tobacco showed growth of 1.5%. However, this was partially offset by a fall of 3.6% in the manufacture of textiles, wearing apparel and leather, which fell for the sixth consecutive quarter.
Construction
Construction output is shown to have fallen by 0.9% in Quarter 1 2024 following a decline of 0.9% in the previous quarter. The level of construction output in Quarter 1 2024 was 0.7% lower than the same quarter a year ago.
The fall reflects a decline in new work of 1.8% driven by private commercial new work, which fell by 5.3%. However, repair and maintenance increased 0.3%. Anecdotal evidence from the Bank of England's Agents' summary of business conditions report for Quarter 1 2024 suggests housing associations were re-directing budgets towards repairs and upgrading to deal with problems such as damp arising from tenants using less heating because of the higher cost of living.
Data from the Met Office (PDF, 4.56MB) show wet weather in February 2024, which is likely to have had adverse effects on the construction sector. Construction output fell by 2.0% in February 2024 with declines in both new work, and repair and maintenance.
Household consumption
There was an increase of 0.2% in real household expenditure in Quarter 1 2024, following declines in the previous two quarters. Within household consumption, the largest contributions to the growth were from housing, water and fuels, recreation and culture, restaurants and hotels, and household goods and services.
Net tourism contributed negatively to growth in the latest quarter. Net tourism is offset within trade and therefore there is no impact on the gross domestic product (GDP) aggregate. Information on how we measure net tourism is provided in our National Accounts articles: Treatment of tourism in the UK National Accounts. Excluding net tourism, domestic consumption increased by 0.6% in the latest quarter, in line with consumer-facing services in the output approach to measuring GDP, which also increased by 0.6%.
Consumption of government goods and services
Real government consumption expenditure increased by 0.3% in Quarter 1 2024, following an increase of 0.1% in the previous quarter. The increase in government consumption in the latest quarter mainly reflects higher activity in health and transport, which was partially offset by falls in public administration and defence, and education.
The growth in health may reflect less impact of industrial action compared with previous quarters. Further information is provided in our monthly GDP release.
Gross capital formation
Gross fixed capital formation (GFCF) is estimated to have increased by 1.4% in the latest quarter, following growth of 0.9% in Quarter 4 2023. Growth was driven by increases in dwellings and other buildings.
Within gross fixed capital formation, business investment is estimated to have increased by 0.9% in Quarter 1 2024, following a 1.4% increase in the previous quarter. Compared with the same quarter a year ago, business investment is estimated to have fallen by 0.6%.
Excluding the alignment and balancing adjustments, early estimates show that inventories fell by £706 million in Quarter 1 2024. In current price terms, estimates show that there was an increase of £3.2 billion in the latest quarter driven by higher stocks in the manufacturing sector.
Net trade
The UK's trade deficit for goods and services was 0.6% of nominal gross domestic product (GDP) in Quarter 1 2024. However, this includes non-monetary gold, which is an erratic series, so it can be useful to exclude this from the trade balance. Excluding non-monetary gold, the trade deficit was 1.1% of nominal GDP in Quarter 1 2024
Export volumes fell by 1.0% in the latest quarter, the fifth consecutive quarterly fall. The decline in the latest quarter was driven by a 3.4% fall in goods exports, which offset a 1.0% increase in services exports.
The decline in goods exports was mainly driven by large movements in non-monetary gold, however, this series also appears within gross capital formation (GCF) as valuables and so the effect is GDP neutral. Elsewhere there were falls in machinery and transport equipment, and fuels.
The increase in services exports was driven mainly by travel, transport and intellectual property services.
Import volumes fell by 2.3% in the latest quarter, following a fall of 0.3% in Quarter 4 2023. The decline in the latest quarter was driven by a 2.9% fall in goods and 1.3% in services.
The fall in goods imports was driven by declines in machinery and transport equipment, in particular in imports of cars and mechanical power generators. The fall in services imports was mainly because of declines in insurance and pensions, and intellectual property services.
Income
Nominal gross domestic product (GDP) increased by 1.2% in Quarter 1 (Jan to Mar) 2024, following a fall of 0.2% in the previous quarter. Growth in nominal GDP was driven by increases in gross operating surplus of corporations, taxes less subsidies, other income and compensation of employees.
Compensation of employees increased by 0.2% in the latest quarter, driven by an increase of 0.7% in wages and salaries, which offset a 2.2% decline in employers' social contributions.
Early estimates show that taxes less subsidies increased by 1.4% in Quarter 1 2024, following no growth in the previous quarter. Growth in the latest quarter was driven by a 1.1% increase in taxes (mainly Value Added Tax) and a 2.0% decline in subsidies.
Total gross operating surplus (GOS) of corporations excluding the alignment adjustment, increased by 1.6% (Table 3) with increases in non-financial corporations. Within GOS of corporations there is uncertainty around the full impacts of the Energy Bill Relief and Energy Price Guarantee schemes that impact the first half of 2023. This is because we do not have up-to-date quarterly information on the gross trading profits of businesses as these data are collected from HM Revenue and Customs (HMRC) and are available with a lag of approximately two years. As such we rely on contextual data (as outlined in our Profitability of UK companies Quality and Methodology Information) from other sources to inform these quarterly estimates.
Read the full ONS report with many links and graphs to more data HERE
Our Social Media